The University of Texas Health Science Center at San Antonio
The University of Texas Health Science Center at San Antonio is located in San Antonio, Texas. It is a public, 4-year or above institution.
From Wikipedia: The University of Texas at San Antonio Health Science Center Campus (UT Health SA or UT San Antonio Health Science Center) is a public academic health science center in San Antonio, Texas and is the medical education, and clinical branch of UT San Antonio. It is located in the South Texas Medical Center and serves San Antonio and all of the 50,000 square miles (130,000 km2) area of Central and South Texas. It extends to campuses in the Texas border communities of Laredo and the Lower Rio Grande Valley. The UT San Antonio Health Science Center produces more than 42,550 graduates; more than 4,700 students a year train in an environment that involves more than 100 affiliated hospitals, clinics and health care facilities in South Texas. The university offers more than 65 degrees, the large majority of them being graduate and professional degrees, in the biomedical and health sciences fields. The Health Science Center Campus is home to the Mays Cancer Center, which is in partnership with the MD Anderson Cancer Center and is a designated a National Cancer Institute Cancer Center. The Mays Cancer Center’s Institute for Drug Development (IDD) is internationally recognized for conducting one of the largest oncology Phase I clinical drug trials programs in the world. Fifteen of the cancer drugs most recently approved by the United States Food & Drug Administration underwent development or testing at the IDD. Other noted programs include: cellular and structural biology, urology, nephrology, transplantation biology, aging and longevity studies, cardiology and research imaging. UT San Antonio Medical School publishes a periodic magazine, Mission. In August 2024, the University of Texas Board of Regents announced that the University of Texas at San Antonio and UT Health Science Center at San Antonio would merge to form a “world class university in San Antonio.” The integrated universities will retain the UTSA name. On August 22, 2025 the University was soft launched into the merger as part of the new UT San Antonio branding. The merger officially took effect on September 1, 2025 effectively folding UT Health SA into the new UT San Antonio.
Overview of institution
This, and the rest of the page, use info from the most recent year available, generally 2024.
Institution kind: Special Focus Four-Year: Research Institutions
Undergrad program: Professions focus, high graduate coexistence
Graduate program: Research Doctoral: STEM-dominant
Enrollment profile: Majority graduate (see more details below)
Average net price for undergrads on financial aid: Unknown .
Actual price for your family: Go here to see what your family may be asked to pay. It can be MUCH lower than the average price but also higher for some.
Size and setting: Four-year, medium, primarily nonresidential
In state percentage: Unknown of first year students come from Texas
In US percentage: Unknown of first year students come from the US
Student to tenure-stream faculty ratio: 2.6 (undergrads to tenure-stream faculty) [Tenure explained]
Student to faculty ratio: 0.8 (undergrads to all faculty)
Degrees offered: Certificate of less than 1 year, Certificate of less than 12 weeks, Certificate of at least 1 year but less than 2 years, Bachelor’s degree, Postbaccalaureate certificate, Master’s degree, Post master’s certificate, Doctor’s degree: research scholarship, Doctor’s degree: professional practice
Schedule: Semester
Institution provides on campus housing: No
Freshmen required to live on campus: Not applicable
Advanced placement (AP) credits used: Yes
Disabilities: 5.90 percent of undergrads are registered as having disabilities.
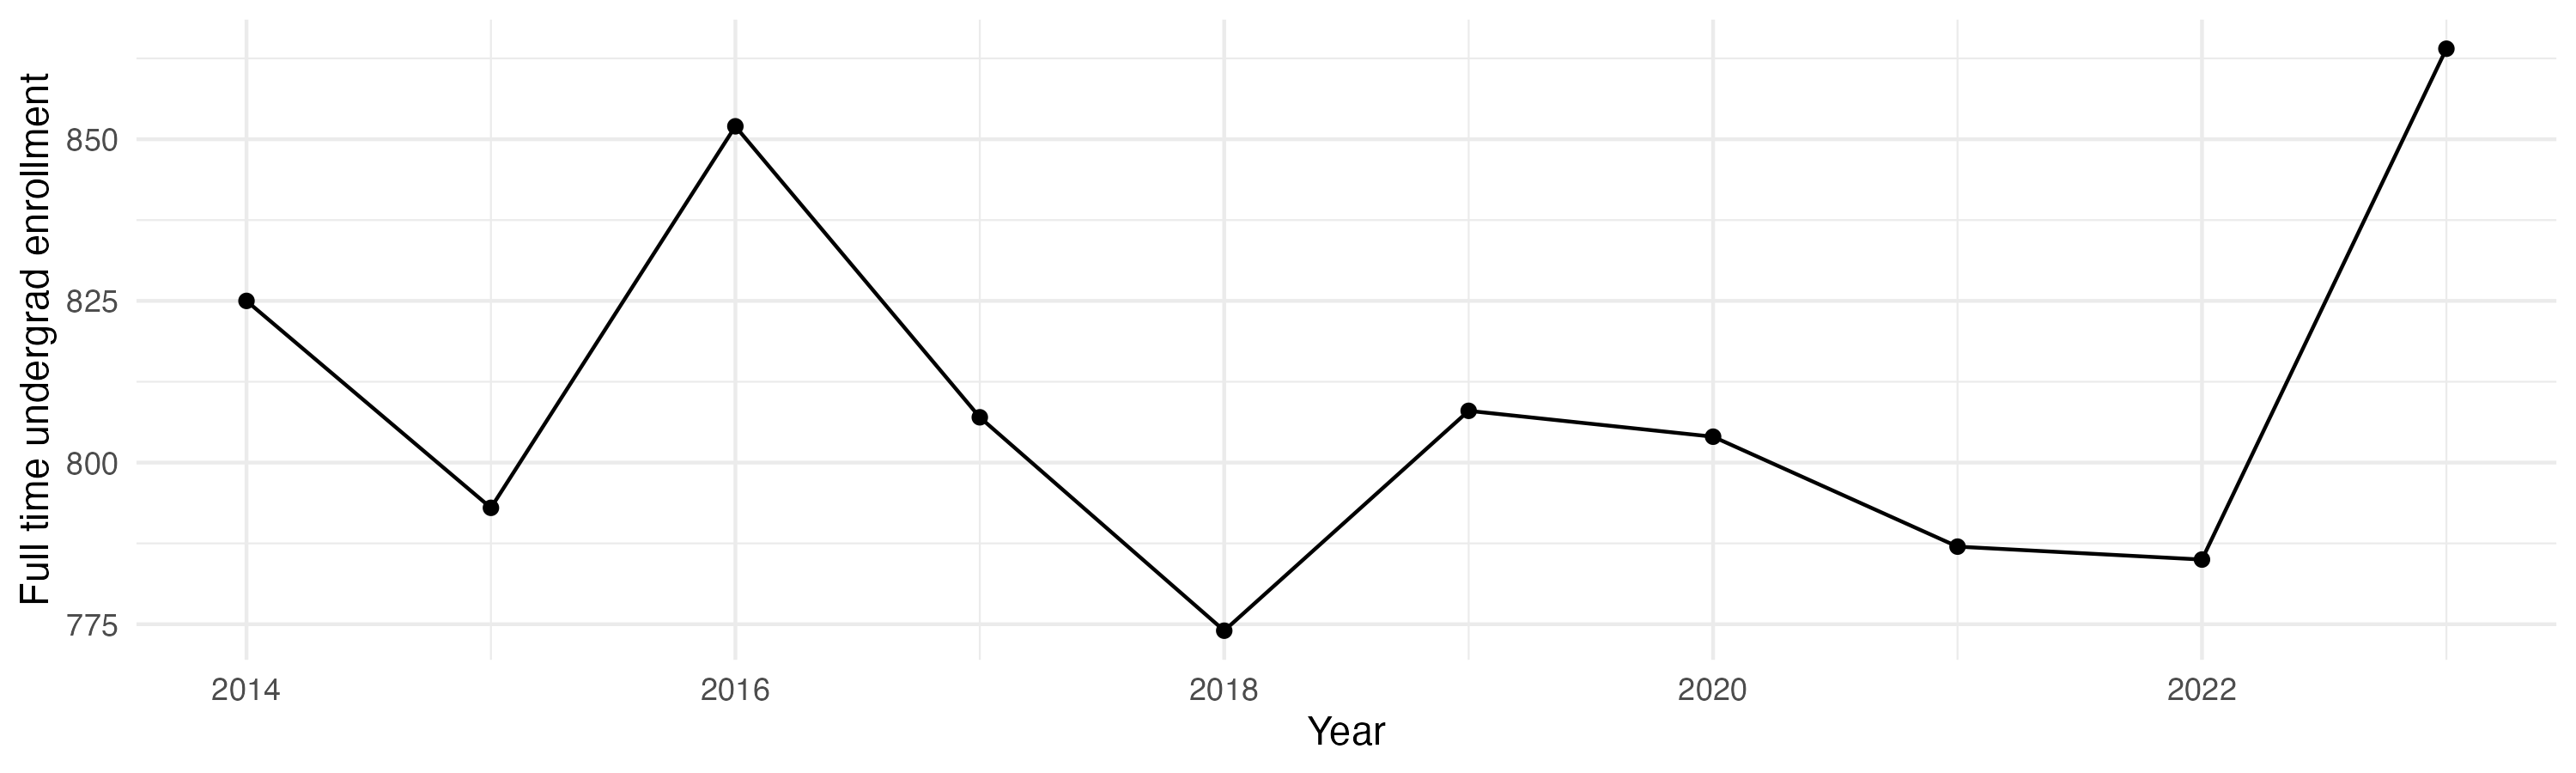
Undergrad outcomes
This plot shows the outcomes for first time, full time undergraduates seeking Bachelor’s degrees (if the data are available).
Map
Comparisons
The sections below show this institution compared with others. The ones listed are ones it has identified as peers, who consider themselves peers, and/or who the federal government considers peers. If a comparison school has the same value as the focal school, its cell is grayed out. In fields where there is a common view that higher (or lower) values are better, the best values are in blue, the worst values are in red. If there isn’t a sense of a particular value being better, values are shown in varying shades of green. Arrows show where there is a signficant trend over time for a school. You can swipe across the table to see more of it; the focal school column is always visible.
- The University of Texas Health Science Center at San Antonio lists these schools as ones to compare itself within federal IPEDS data, and they do the same back: The University of Texas Health Science Center at Houston, The University of Texas Medical Branch at Galveston, Louisiana State University Health Sciences Center-New Orleans
- The University of Texas Health Science Center at San Antonio compares itself to these institutions, but not vice versa: University of Nebraska Medical Center, Texas Tech University Health Sciences Center, University of Oklahoma-Health Sciences Center, Thomas Jefferson University, University of Arkansas for Medical Sciences, Oregon Health & Science University, University of North Texas Health Science Center
- These institutions compare themselves to The University of Texas Health Science Center at San Antonio, but not vice versa: Hallmark University, The University of Tennessee Health Science Center, University of Puerto Rico-Medical Sciences, SUNY Downstate Health Sciences University, Medical University of South Carolina, Louisiana State University Health Sciences Center-Shreveport, Touro University Nevada
Enrollment
General
Teaching
Tenure track faculty are those who are eligible for tenure. This includes both pre-tenure and tenured faculty. Once faculty get tenure, they are (generally) protected from being fired for intellectual reasons, helping to ensure their freedom in teaching and research. They can still lose their positions for misconduct, financial problems, not fulfilling their duties, or other reasons.
Non-tenure track faculty are not eligible for tenure. Some are hired one semester at a time, some have multi-year contracts. They typically have a higher teaching load than tenure track faculty, leaving less time for research or other creative endeavors. They are also easier to fire than tenured faculty. Sometimes they are external experts (a noted musician, a former senator) who are hired to teach some classes without the expected permanence of a tenure-track position.
Note that this chart uses US federal demographic data: it only has two genders and a specified set of ethnicities and races.
Having a low student to faculty ratio is considered a good thing by many, as it can mean more individual attention.
Geography
This has information on the location of the institution. See the about page for more information on what the metrics are and how they are calculated.
Financial Aid
Graduation
Note these are bachelors graduation rates in six years, not four (this is standard). Sample sizes can be small for some demographic groups with few individuals in a school, leading to large year-to-year fluctuations and often extreme values for those groups (if there are two individuals in the class with a given identity, the possible graduation rates are 0%, 50%, or 100% depending on whether zero, one, or both students graduate within six years).
Library
Libraries are changing rapidly. Note that how institutions count digital collections may vary.
Diversity
The US Census Bureau has a diversity index that goes from 0 to 1. In their words, “A 0-value indicates that everyone in the population has the same racial and ethnic characteristics. A value close to 1 indicates that everyone in the population has different racial and ethnic characteristics.” This uses their formula, but with the resolution available for the federal IPEDS data (which does not separate for a given demographic group whether members identify as Hispanic or not). This metric is about heterogeneity within the population, not the proportion of the population that comes from historically excluded groups.
Following the practice of the census, the index is multiplied by 100 to give the percentage probability a random pair of individuals will have a different background. Most institutions argue that diversity is a benefit, so by default a higher number is listed as better, but there may be cases where this measure does not reflect the mission of a college (for example, 70% of the students at a tribal college or university may be American Indian: that could be low-scoring by this metric but should not be read as “bad” given the institution’s mission).
These numbers are based on the most recent year available, generally 2024, which predates effects of the US Supreme Court’s striking down of affirmative action. This has often changed, sometimes dramatically, the incoming student demographics at some institutions.
Overall diversity
Freshman profile
Demographic data for first time degree-seeking students. Note that this uses US federal demographic data: it only has two genders and a specified set of ethnicities and races.
Freshman geography
Test scores
SAT scores
ACT scores
Majors
This presents information on the number of majors and the median earnings one and five years after graduation for people who got a degree from this institution in that field. The earnings are for those who are working and not enrolled in further education. The earnings data (from the federal college scorecard) also has information on earnings for those categorized as ‘MALE’ and ‘NOMALE’ – for readability, these are recategorized here as “Men” and “Women”, respectively, which adopts the gender binary used in other federal data. “W/M earnings ratio” is the median earnings of women divided by men, as a percentage.
Bachelors
Masters
Doctorate
Certificate
Associates
Demographic cliff
There is a concern that giving changing US demographics, the number of students in the age groups who most commonly attend four year colleges will drop off, decreasing overall enrollment. This is often referred to as the “demographic cliff”, and it can be a concern for colleges concerned about the risk of falling enrollment. For this section, the analysis uses US census data on the number of people in each state by age, and the proportion of students that come from each state for this particular college, to crudely model what will happen if everything remains constant except the demographic change in the population of 18 year olds in each year – it does not account for things like the college increasing its admission rate, attracting more students from states without the same demographic changes or from other countries, or changes in the proportion of students who go to college.