California State Polytechnic University-Pomona
California State Polytechnic University-Pomona is located in Pomona, California. It is a public, 4-year or above institution.
From Wikipedia: California State Polytechnic University, Pomona (Cal Poly Pomona) is a public polytechnic research university in Pomona, California, United States. It is the largest of the three polytechnic universities in the California State University system by enrollment. Cal Poly Pomona began as a southern campus of the California Polytechnic School (now known as Cal Poly San Luis Obispo) in 1938, following the donation of the Voorhis School for Boys and its adjacent farm in San Dimas by Charles and Jerry Voorhis. This Pomona campus expanded in 1949 when it was gifted the W.
Overview of institution
This, and the rest of the page, use info from the most recent year available, generally 2024.
Institution kind: Master’s Colleges & Universities: Larger Programs
Undergrad program: Professions plus arts & sciences, some graduate coexistence
Graduate program: Research Doctoral: Single program-Education
Enrollment profile: Very high undergraduate (see more details below)
Average net price for undergrads on financial aid: $11,898 . This is 70% the average cost of Harvard.
Actual price for your family: Go here to see what your family may be asked to pay. It can be MUCH lower than the average price but also higher for some.
Size and setting: Four-year, large, primarily nonresidential
In state percentage: 98% of first year students come from California
In US percentage: 99% of first year students come from the US
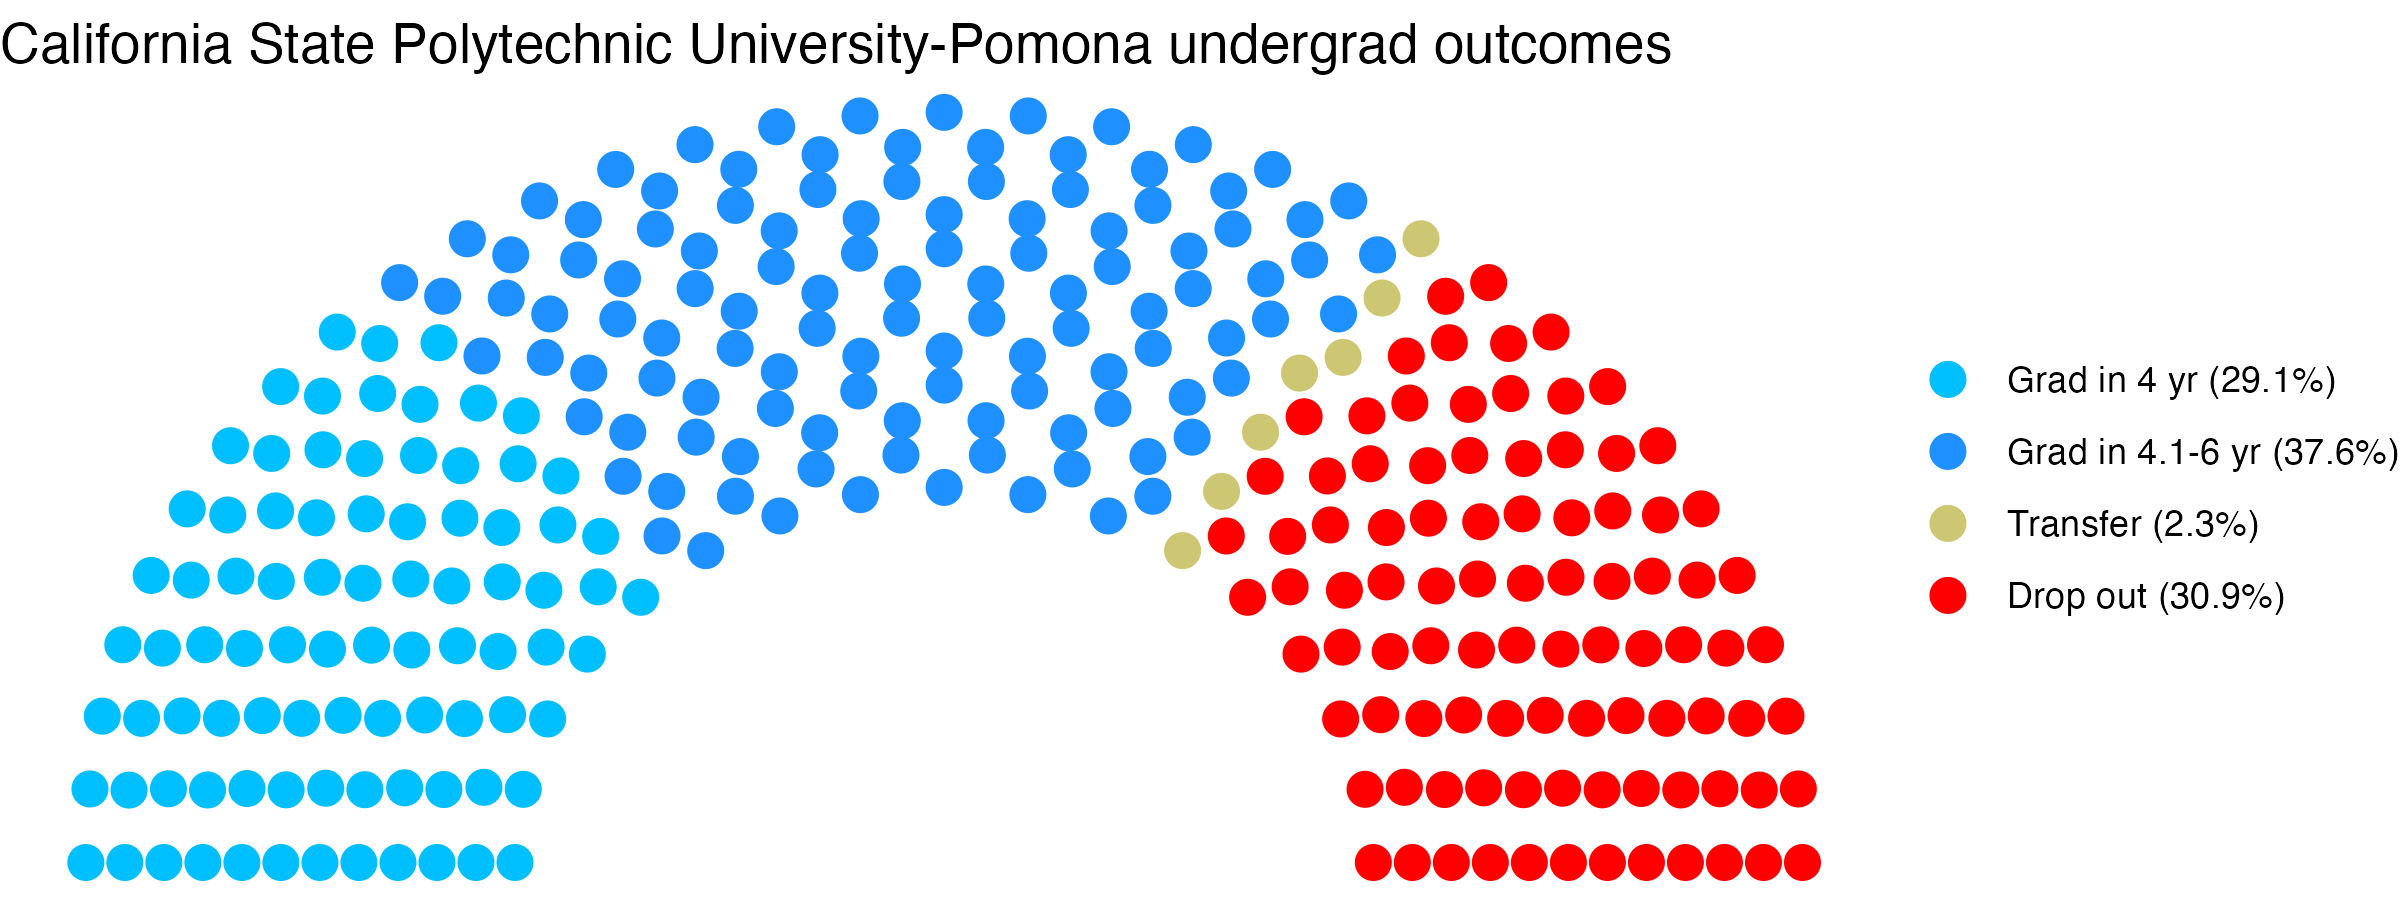
Graduation rate (within 6 years) for students seeking a Bachelors: 66.7% (this is what is usually reported as “graduation rate”)
Graduation rate (within 4 years) for students seeking a Bachelors: 29.1%
Percent of students seeking a Bachelors who transfer out of this institution: 2.3%
Student to tenure-stream faculty ratio: 37.8 (undergrads to tenure-stream faculty) [Tenure explained]
Student to faculty ratio: 31.3 (undergrads to all faculty)
Degrees offered: Bachelor’s degree, Postbaccalaureate certificate, Master’s degree, Doctor’s degree: research scholarship
Schedule: Semester
Institution provides on campus housing: Yes
Dorm capacity: There are enough dorm beds for 4177 students
Freshmen required to live on campus: No
Advanced placement (AP) credits used: Yes
Disabilities: 5.00 percent of undergrads are registered as having disabilities.
Undergrad outcomes
This plot shows the outcomes for first time, full time undergraduates seeking Bachelor’s degrees (if the data are available).
Map
Comparisons
The sections below show this institution compared with others. The ones listed are ones it has identified as peers, who consider themselves peers, and/or who the federal government considers peers. If a comparison school has the same value as the focal school, its cell is grayed out. In fields where there is a common view that higher (or lower) values are better, the best values are in blue, the worst values are in red. If there isn’t a sense of a particular value being better, values are shown in varying shades of green. Arrows show where there is a signficant trend over time for a school. You can swipe across the table to see more of it; the focal school column is always visible.
- California State Polytechnic University-Pomona lists these schools as ones to compare itself within federal IPEDS data, and they do the same back: California State University-San Bernardino, Eastern Michigan University
- California State Polytechnic University-Pomona compares itself to these institutions, but not vice versa: San Diego State University, California State University-Long Beach, Kennesaw State University, CUNY Hunter College, University of North Florida, University of Cincinnati-Main Campus, University of North Carolina at Charlotte, The University of Texas Rio Grande Valley, Middle Tennessee State University, Florida Atlantic University, California State University-Fullerton, Oakland University, The University of Texas at Arlington, San Jose State University, Towson University, CUNY Brooklyn College, Georgia Southern University, CUNY Queens College, Texas State University, University of Nevada-Las Vegas, The University of Texas at San Antonio, East Carolina University, California State University-Northridge, University of New Mexico-Main Campus, Western Michigan University, University of Wisconsin-Milwaukee, Youngstown State University, California State University-Sacramento, Northern Arizona University, Southeastern Louisiana University, University of Nebraska at Omaha, California State University-Fresno, Portland State University, University of Toledo, Kean University, California State University-Los Angeles, California State University-Chico, Wichita State University, San Francisco State University, Northern Kentucky University, Cleveland State University, Saint Cloud State University
- These institutions compare themselves to California State Polytechnic University-Pomona, but not vice versa: United States Air Force Academy, University of Puerto Rico-Mayaguez, Embry-Riddle Aeronautical University-Daytona Beach, CUNY John Jay College of Criminal Justice, Embry-Riddle Aeronautical University-Prescott, DeVry University-California, Missouri State University-Springfield, Embry-Riddle Aeronautical University-Worldwide, Rutgers University-Camden, University of Wisconsin-Stout, Southern Illinois University Edwardsville, California State University-San Marcos, University of Houston-Downtown, California State Polytechnic University-Humboldt, DeVry University-Nevada, Claremont Graduate University
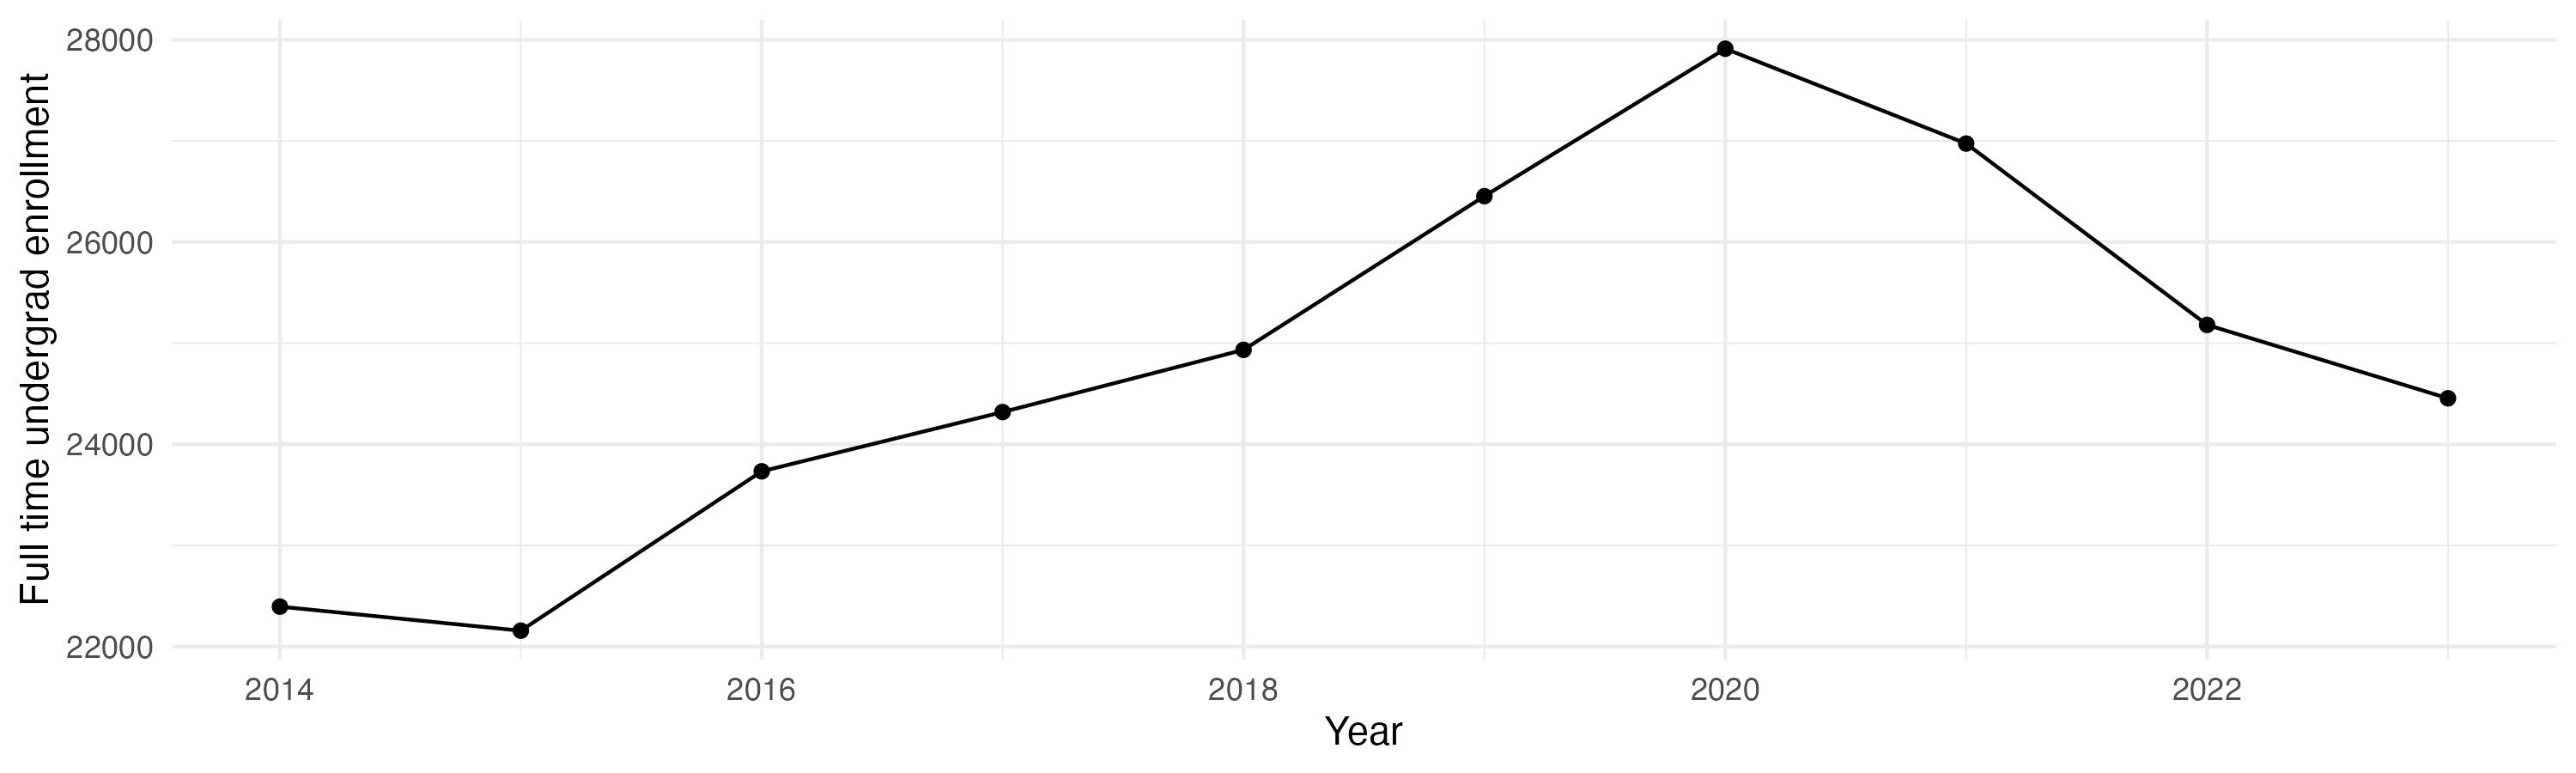
Enrollment
General
Teaching
Tenure track faculty are those who are eligible for tenure. This includes both pre-tenure and tenured faculty. Once faculty get tenure, they are (generally) protected from being fired for intellectual reasons, helping to ensure their freedom in teaching and research. They can still lose their positions for misconduct, financial problems, not fulfilling their duties, or other reasons.
Non-tenure track faculty are not eligible for tenure. Some are hired one semester at a time, some have multi-year contracts. They typically have a higher teaching load than tenure track faculty, leaving less time for research or other creative endeavors. They are also easier to fire than tenured faculty. Sometimes they are external experts (a noted musician, a former senator) who are hired to teach some classes without the expected permanence of a tenure-track position.
Note that this chart uses US federal demographic data: it only has two genders and a specified set of ethnicities and races.
Having a low student to faculty ratio is considered a good thing by many, as it can mean more individual attention.
Geography
This has information on the location of the institution. See the about page for more information on what the metrics are and how they are calculated.
Financial Aid
Graduation
Note these are bachelors graduation rates in six years, not four (this is standard). Sample sizes can be small for some demographic groups with few individuals in a school, leading to large year-to-year fluctuations and often extreme values for those groups (if there are two individuals in the class with a given identity, the possible graduation rates are 0%, 50%, or 100% depending on whether zero, one, or both students graduate within six years).
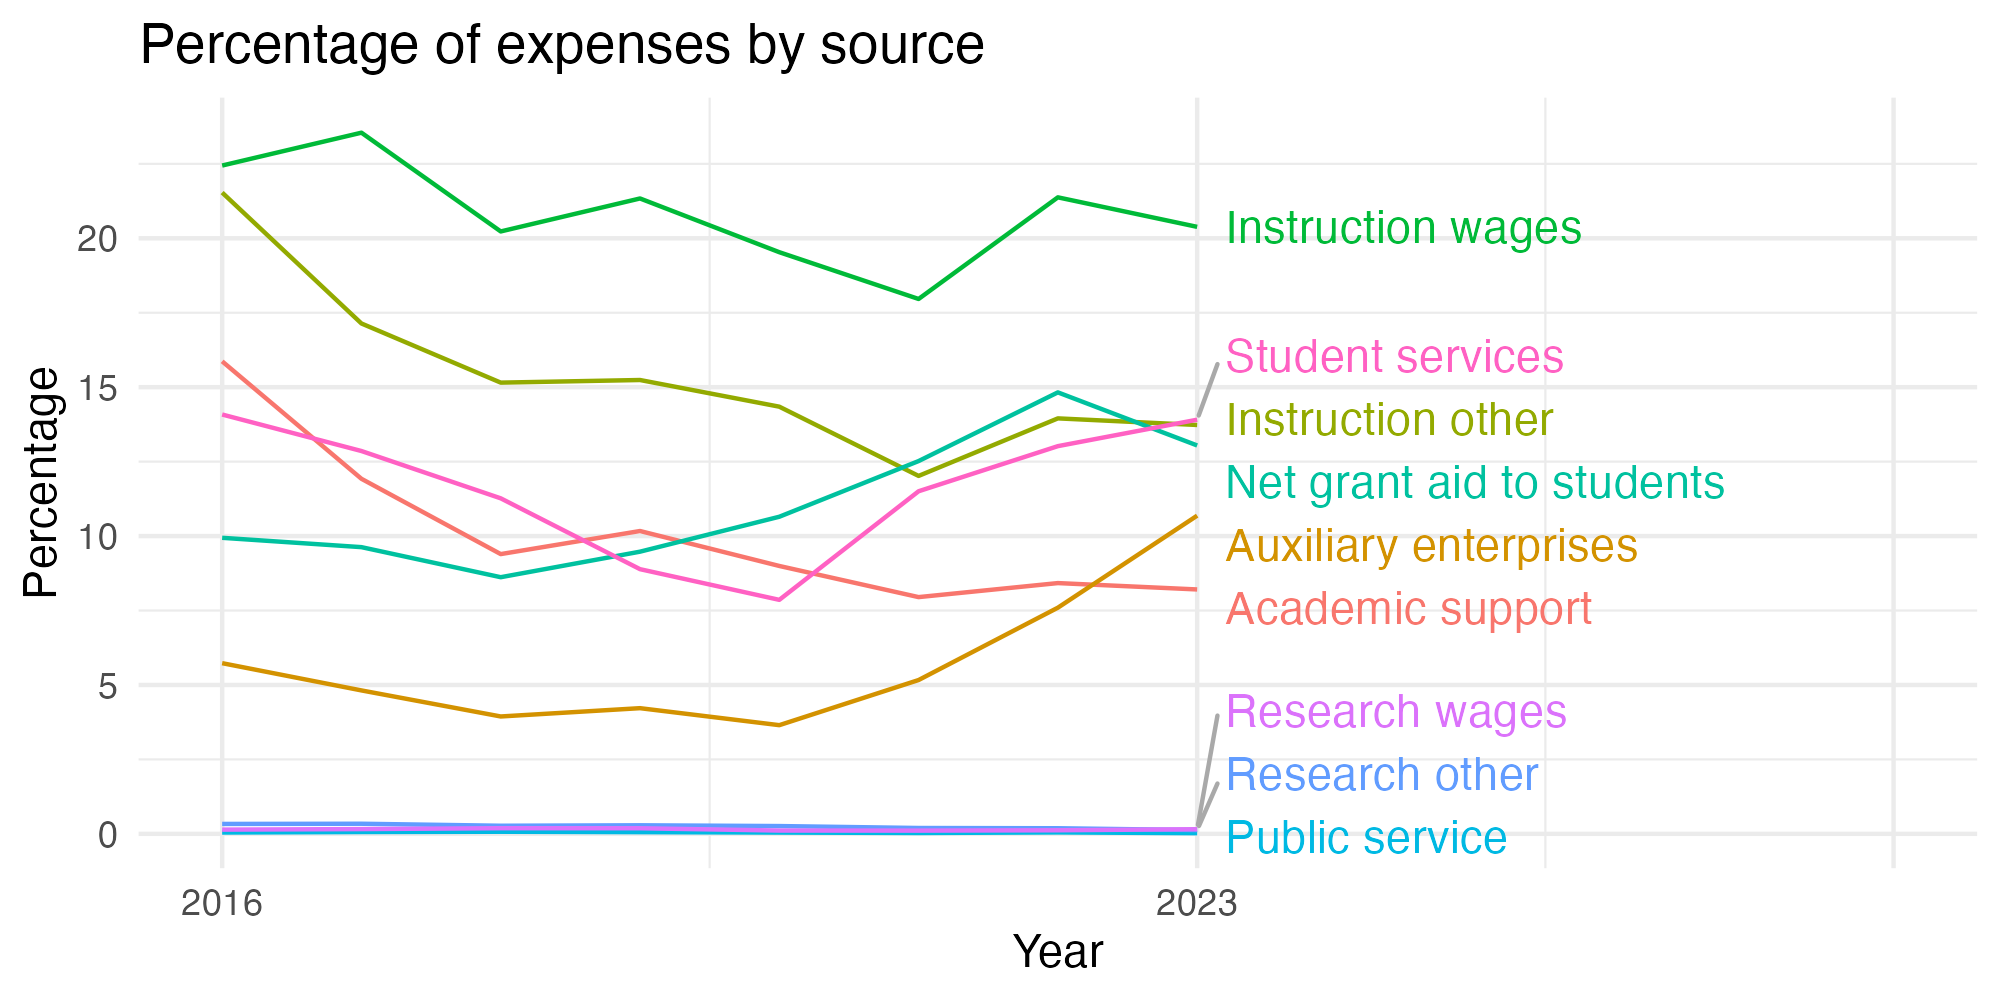
Expense distribution
Colleges have various expenses, and the share of those has changed through time. A recent (July 1, 2026) article suggested that faculty salaries tend to be decreasing as a component of all college expenses. This plot (if data are available) shows wages and salaries used for instruction (which include faculty and others supporting instruction), other instructional costs, and other costs as a percentage of a college’s overall reported expenses each year.
Library
Libraries are changing rapidly. Note that how institutions count digital collections may vary.
Diversity
The US Census Bureau has a diversity index that goes from 0 to 1. In their words, “A 0-value indicates that everyone in the population has the same racial and ethnic characteristics. A value close to 1 indicates that everyone in the population has different racial and ethnic characteristics.” This uses their formula, but with the resolution available for the federal IPEDS data (which does not separate for a given demographic group whether members identify as Hispanic or not). This metric is about heterogeneity within the population, not the proportion of the population that comes from historically excluded groups.
Following the practice of the census, the index is multiplied by 100 to give the percentage probability a random pair of individuals will have a different background. Most institutions argue that diversity is a benefit, so by default a higher number is listed as better, but there may be cases where this measure does not reflect the mission of a college (for example, 70% of the students at a tribal college or university may be American Indian: that could be low-scoring by this metric but should not be read as “bad” given the institution’s mission).
These numbers are based on the most recent year available, generally 2024, which predates effects of the US Supreme Court’s striking down of affirmative action. This has often changed, sometimes dramatically, the incoming student demographics at some institutions.
Overall diversity
Freshman profile
Demographic data for first time degree-seeking students. Note that this uses US federal demographic data: it only has two genders and a specified set of ethnicities and races.
Freshman geography
Test scores
SAT scores
ACT scores
Majors
This presents information on the number of majors and the median earnings one and five years after graduation for people who got a degree from this institution in that field. The earnings are for those who are working and not enrolled in further education. The earnings data (from the federal college scorecard) also has information on earnings for those categorized as ‘MALE’ and ‘NOMALE’ – for readability, these are recategorized here as “Men” and “Women”, respectively, which adopts the gender binary used in other federal data. “W/M earnings ratio” is the median earnings of women divided by men, as a percentage.
Bachelors
Masters
Doctorate
Certificate
Associates
Demographic cliff
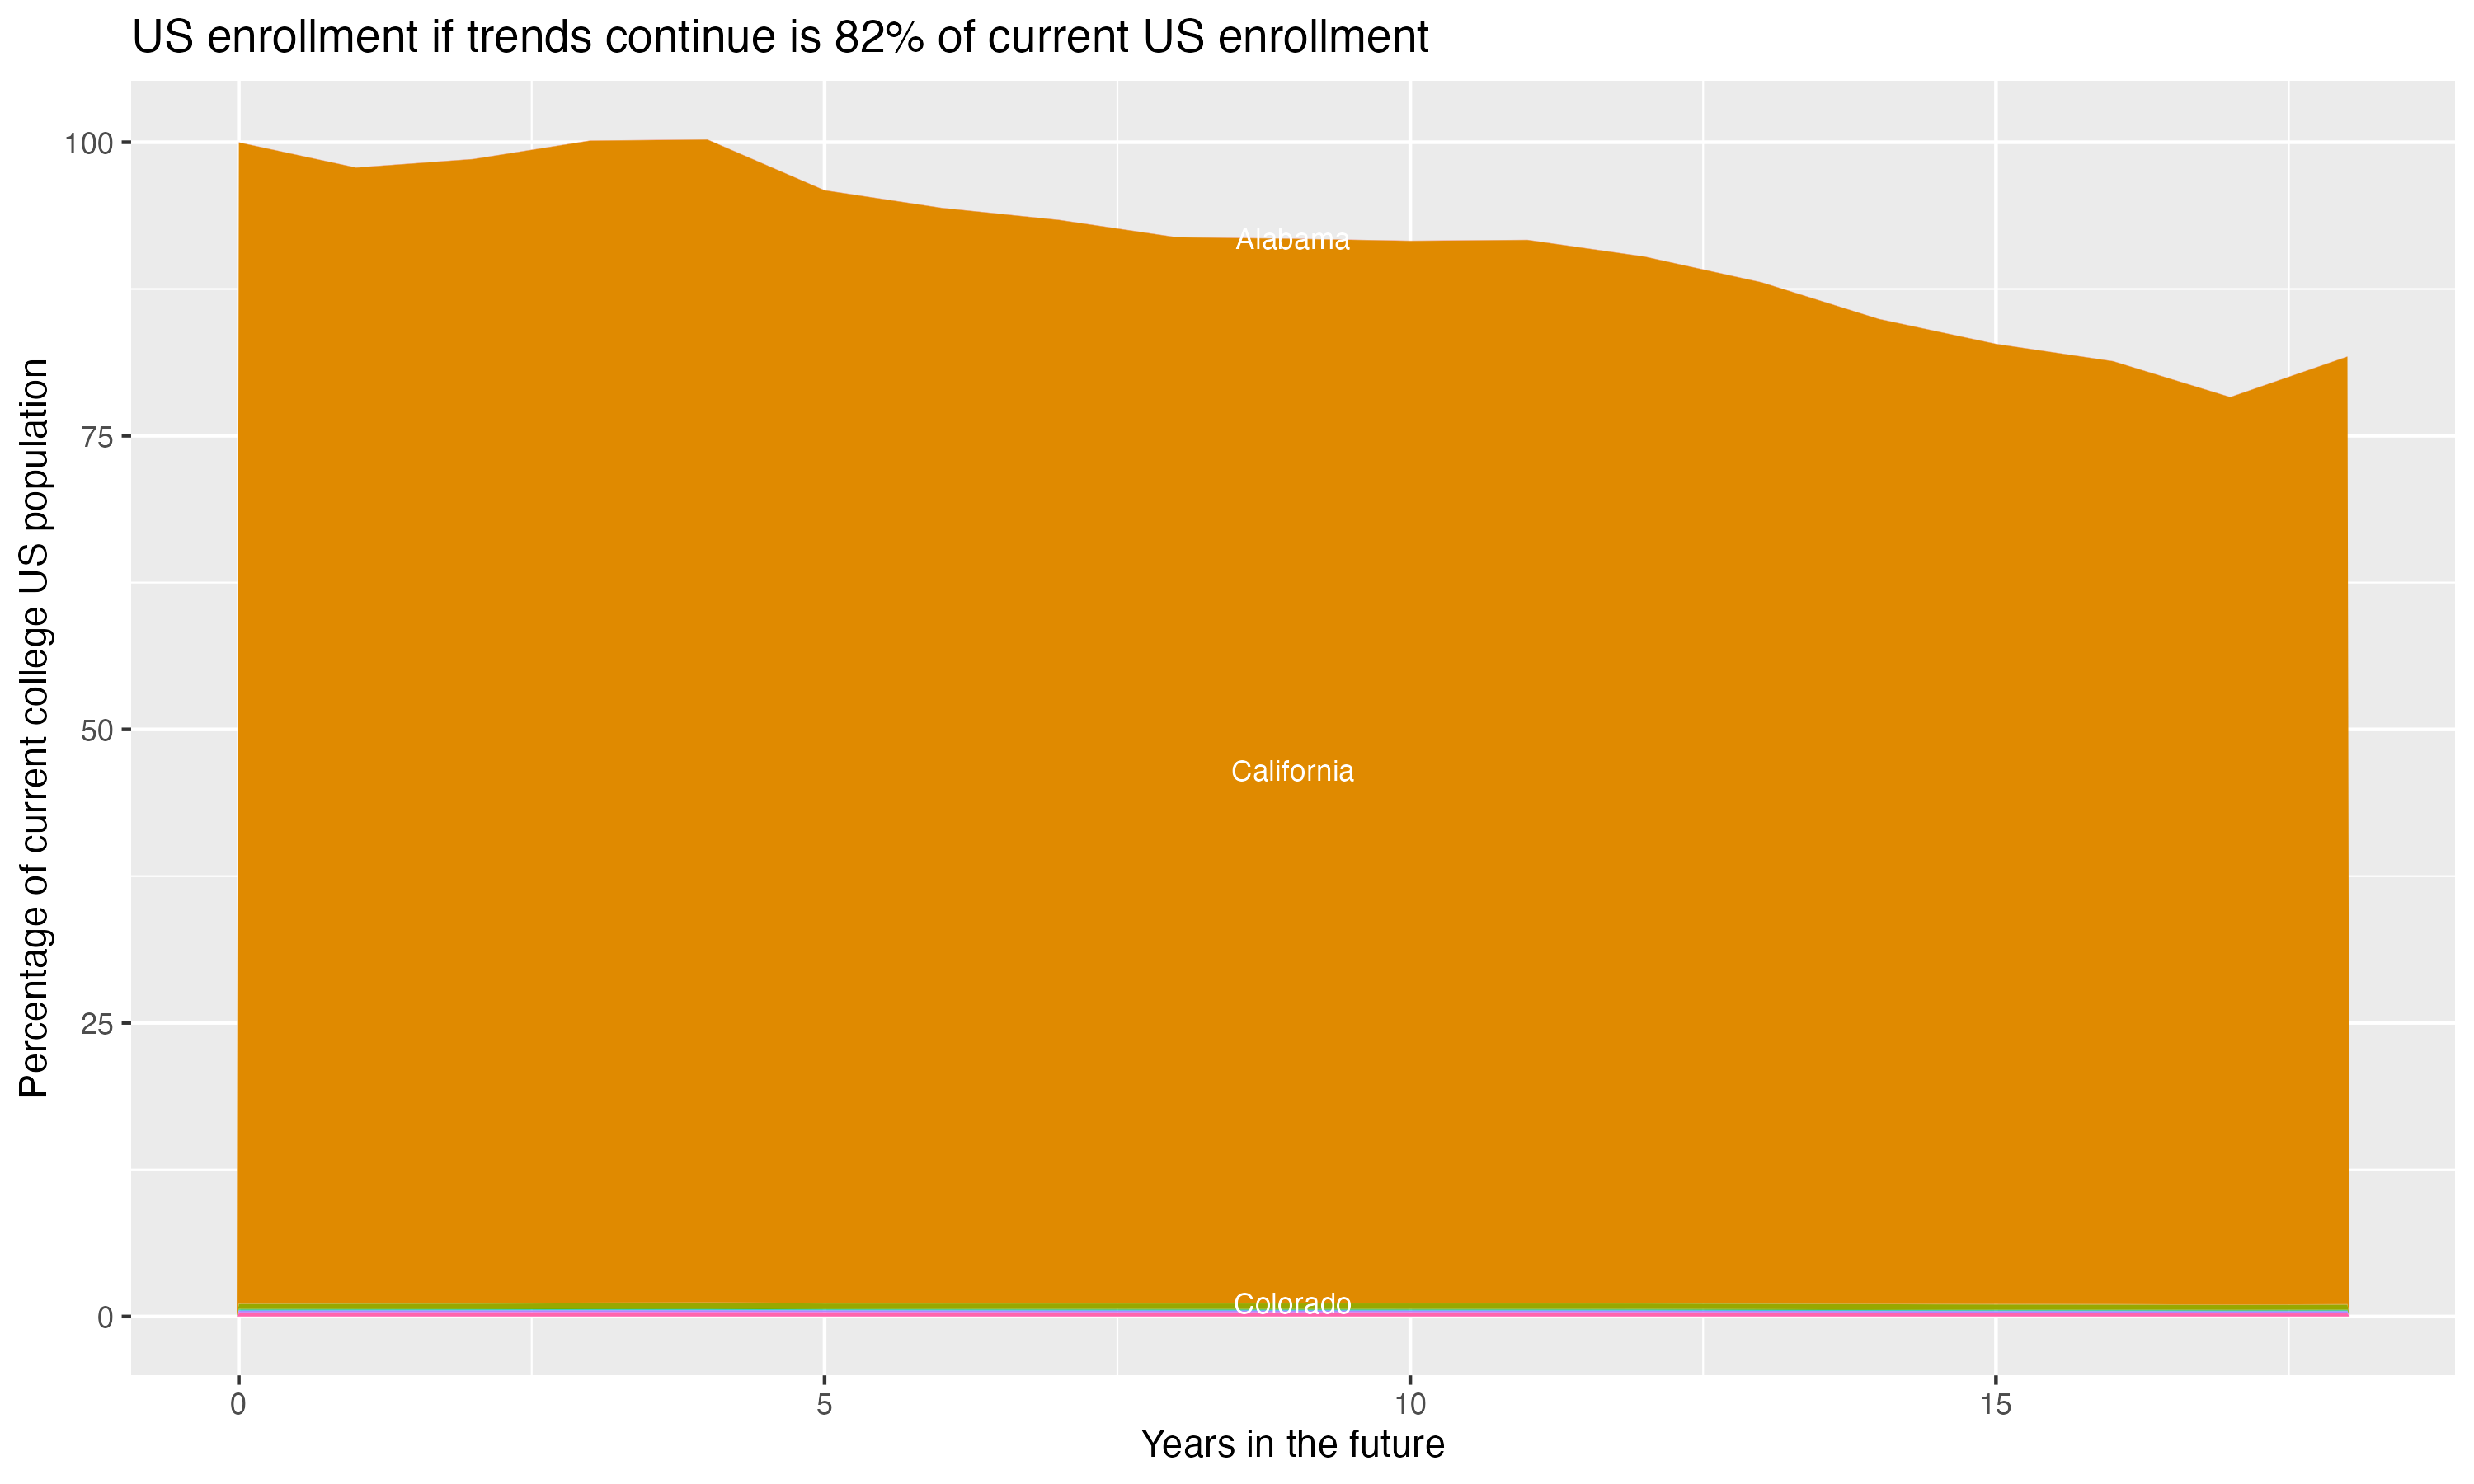
There is a concern that giving changing US demographics, the number of students in the age groups who most commonly attend four year colleges will drop off, decreasing overall enrollment. This is often referred to as the “demographic cliff”, and it can be a concern for colleges concerned about the risk of falling enrollment. For this section, the analysis uses US census data on the number of people in each state by age, and the proportion of students that come from each state for this particular college, to crudely model what will happen if everything remains constant except the demographic change in the population of 18 year olds in each year – it does not account for things like the college increasing its admission rate, attracting more students from states without the same demographic changes or from other countries, or changes in the proportion of students who go to college.