College of Southern Maryland
College of Southern Maryland is located in La Plata, Maryland. It is a public, 2-year institution.
From Wikipedia: The College of Southern Maryland (CSM) is a public community college with campuses in Hughesville, La Plata, Leonardtown, and Prince Frederick, Maryland. It serves students living in Southern Maryland’s Charles, St. Mary’s, and Calvert counties.
Overview of institution
This, and the rest of the page, use info from the most recent year available, generally 2024.
Institution kind: Associate’s Colleges: High Transfer-Mixed Traditional/Nontraditional
Undergrad program: Associate’s Colleges: High Transfer
Graduate program: Not classified (Exclusively Undergraduate)
Enrollment profile: Exclusively undergraduate two-year (see more details below)
Average net price for undergrads on financial aid: $8,690 . This is 50% the average cost of Harvard.
Actual price for your family: Go here to see what your family may be asked to pay. It can be MUCH lower than the average price but also higher for some.
Size and setting: Two-year, medium
In state percentage: 98% of first year students come from Maryland
In US percentage: 100% of first year students come from the US
Student to tenure-stream faculty ratio: 16.9 (undergrads to tenure-stream faculty) [Tenure explained]
Student to faculty ratio: 16.9 (undergrads to all faculty)
Degrees offered: Certificate of less than 1 year, Certificate of at least 12 weeks but less than 1 year, Certificate of at least 1 year but less than 2 years, Associate’s degree
Schedule: Semester
Institution provides on campus housing: No
Freshmen required to live on campus: No
Advanced placement (AP) credits used: Yes
Disabilities: 3 percent or less of undergrads are registered as having disabilities.
Undergrad outcomes
This plot shows the outcomes for first time, full time undergraduates seeking Bachelor’s degrees (if the data are available).
Map
Comparisons
The sections below show this institution compared with others. The ones listed are ones it has identified as peers, who consider themselves peers, and/or who the federal government considers peers. If a comparison school has the same value as the focal school, its cell is grayed out. In fields where there is a common view that higher (or lower) values are better, the best values are in blue, the worst values are in red. If there isn’t a sense of a particular value being better, values are shown in varying shades of green. Arrows show where there is a signficant trend over time for a school. You can swipe across the table to see more of it; the focal school column is always visible.
- College of Southern Maryland lists these schools as ones to compare itself within federal IPEDS data, and they do the same back: Prince George’s Community College, Bristol Community College, Harford Community College, Ocean County College, Community College of Baltimore County, Raritan Valley Community College, Howard Community College, Genesee Community College
- College of Southern Maryland compares itself to these institutions, but not vice versa: Connecticut State Community College, CUNY Bronx Community College, Harrisburg Area Community College, Bunker Hill Community College, CUNY Hostos Community College, Anne Arundel Community College, County College of Morris, Hudson County Community College, Northampton County Area Community College, Onondaga Community College, SUNY Broome Community College, Mohawk Valley Community College, Dutchess Community College, Quinsigamond Community College, Essex County College, Rockland Community College, Orange County Community College, Rowan College at Burlington County, Mercer County Community College, Finger Lakes Community College, Rowan College of South Jersey-Gloucester Campus, Springfield Technical Community College, Niagara County Community College, Massasoit Community College, Middlesex Community College, Passaic County Community College, North Shore Community College, Holyoke Community College, Atlantic Cape Community College, Hagerstown Community College, SUNY Adirondack, Massachusetts Bay Community College, Northern Essex Community College, Allegany College of Maryland, SUNY Corning Community College, Jamestown Community College, Tompkins Cortland Community College, Jefferson Community College, Mount Wachusett Community College, Butler County Community College, Ulster County Community College, Herkimer County Community College, Cape Cod Community College, Schenectady County Community College, Rowan College of South Jersey-Cumberland Campus, Quincy College, Cayuga County Community College, Sussex County Community College, Montgomery College, Community College of Beaver County, Greenfield Community College, Berkshire Community College, Roxbury Community College, Garrett College, Clinton Community College, Delaware Technical Community College-Terry, Southern Maine Community College, Lehigh Carbon Community College, Frederick Community College, Luzerne County Community College, Westmoreland County Community College, Cecil College, Eastern Maine Community College, Baltimore City Community College, NHTI-Concord’s Community College, Carroll Community College, Reading Area Community College, Community College of Vermont, Manchester Community College, Chesapeake College, Wor-Wic Community College, Nashua Community College, White Mountains Community College
Enrollment
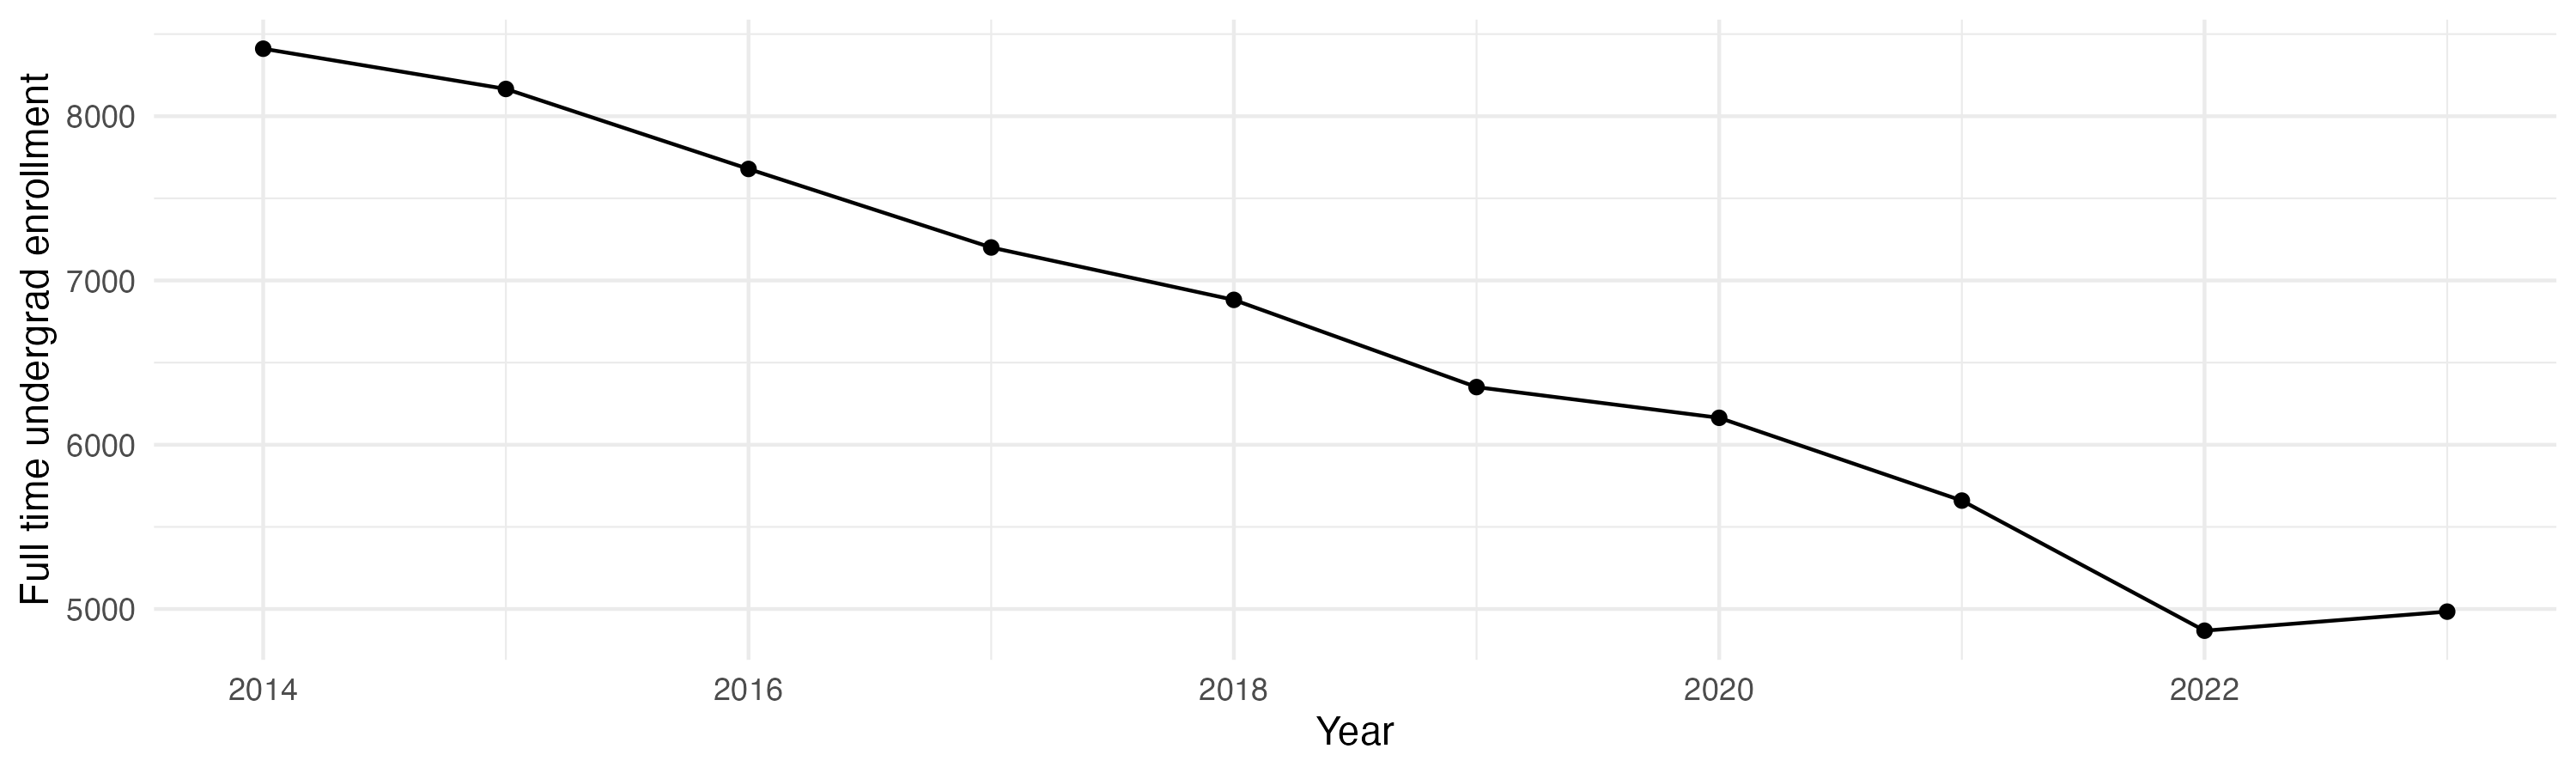
General
Teaching
Tenure track faculty are those who are eligible for tenure. This includes both pre-tenure and tenured faculty. Once faculty get tenure, they are (generally) protected from being fired for intellectual reasons, helping to ensure their freedom in teaching and research. They can still lose their positions for misconduct, financial problems, not fulfilling their duties, or other reasons.
Non-tenure track faculty are not eligible for tenure. Some are hired one semester at a time, some have multi-year contracts. They typically have a higher teaching load than tenure track faculty, leaving less time for research or other creative endeavors. They are also easier to fire than tenured faculty. Sometimes they are external experts (a noted musician, a former senator) who are hired to teach some classes without the expected permanence of a tenure-track position.
Note that this chart uses US federal demographic data: it only has two genders and a specified set of ethnicities and races.
Having a low student to faculty ratio is considered a good thing by many, as it can mean more individual attention.
Geography
This has information on the location of the institution. See the about page for more information on what the metrics are and how they are calculated.
Financial Aid
Graduation
Note these are bachelors graduation rates in six years, not four (this is standard). Sample sizes can be small for some demographic groups with few individuals in a school, leading to large year-to-year fluctuations and often extreme values for those groups (if there are two individuals in the class with a given identity, the possible graduation rates are 0%, 50%, or 100% depending on whether zero, one, or both students graduate within six years).
Library
Libraries are changing rapidly. Note that how institutions count digital collections may vary.
## Error in fn_ecdf(entry_raw): could not find function "fn_ecdf"Diversity
The US Census Bureau has a diversity index that goes from 0 to 1. In their words, “A 0-value indicates that everyone in the population has the same racial and ethnic characteristics. A value close to 1 indicates that everyone in the population has different racial and ethnic characteristics.” This uses their formula, but with the resolution available for the federal IPEDS data (which does not separate for a given demographic group whether members identify as Hispanic or not). This metric is about heterogeneity within the population, not the proportion of the population that comes from historically excluded groups.
Following the practice of the census, the index is multiplied by 100 to give the percentage probability a random pair of individuals will have a different background. Most institutions argue that diversity is a benefit, so by default a higher number is listed as better, but there may be cases where this measure does not reflect the mission of a college (for example, 70% of the students at a tribal college or university may be American Indian: that could be low-scoring by this metric but should not be read as “bad” given the institution’s mission).
These numbers are based on the most recent year available, generally 2024, which predates effects of the US Supreme Court’s striking down of affirmative action. This has often changed, sometimes dramatically, the incoming student demographics at some institutions.
Overall diversity
Freshman profile
Demographic data for first time degree-seeking students. Note that this uses US federal demographic data: it only has two genders and a specified set of ethnicities and races.
Freshman geography
Test scores
SAT scores
ACT scores
Majors
This presents information on the number of majors and the median earnings one and five years after graduation for people who got a degree from this institution in that field. The earnings are for those who are working and not enrolled in further education. The earnings data (from the federal college scorecard) also has information on earnings for those categorized as ‘MALE’ and ‘NOMALE’ – for readability, these are recategorized here as “Men” and “Women”, respectively, which adopts the gender binary used in other federal data. “W/M earnings ratio” is the median earnings of women divided by men, as a percentage.
Bachelors
Masters
Doctorate
Certificate
Associates
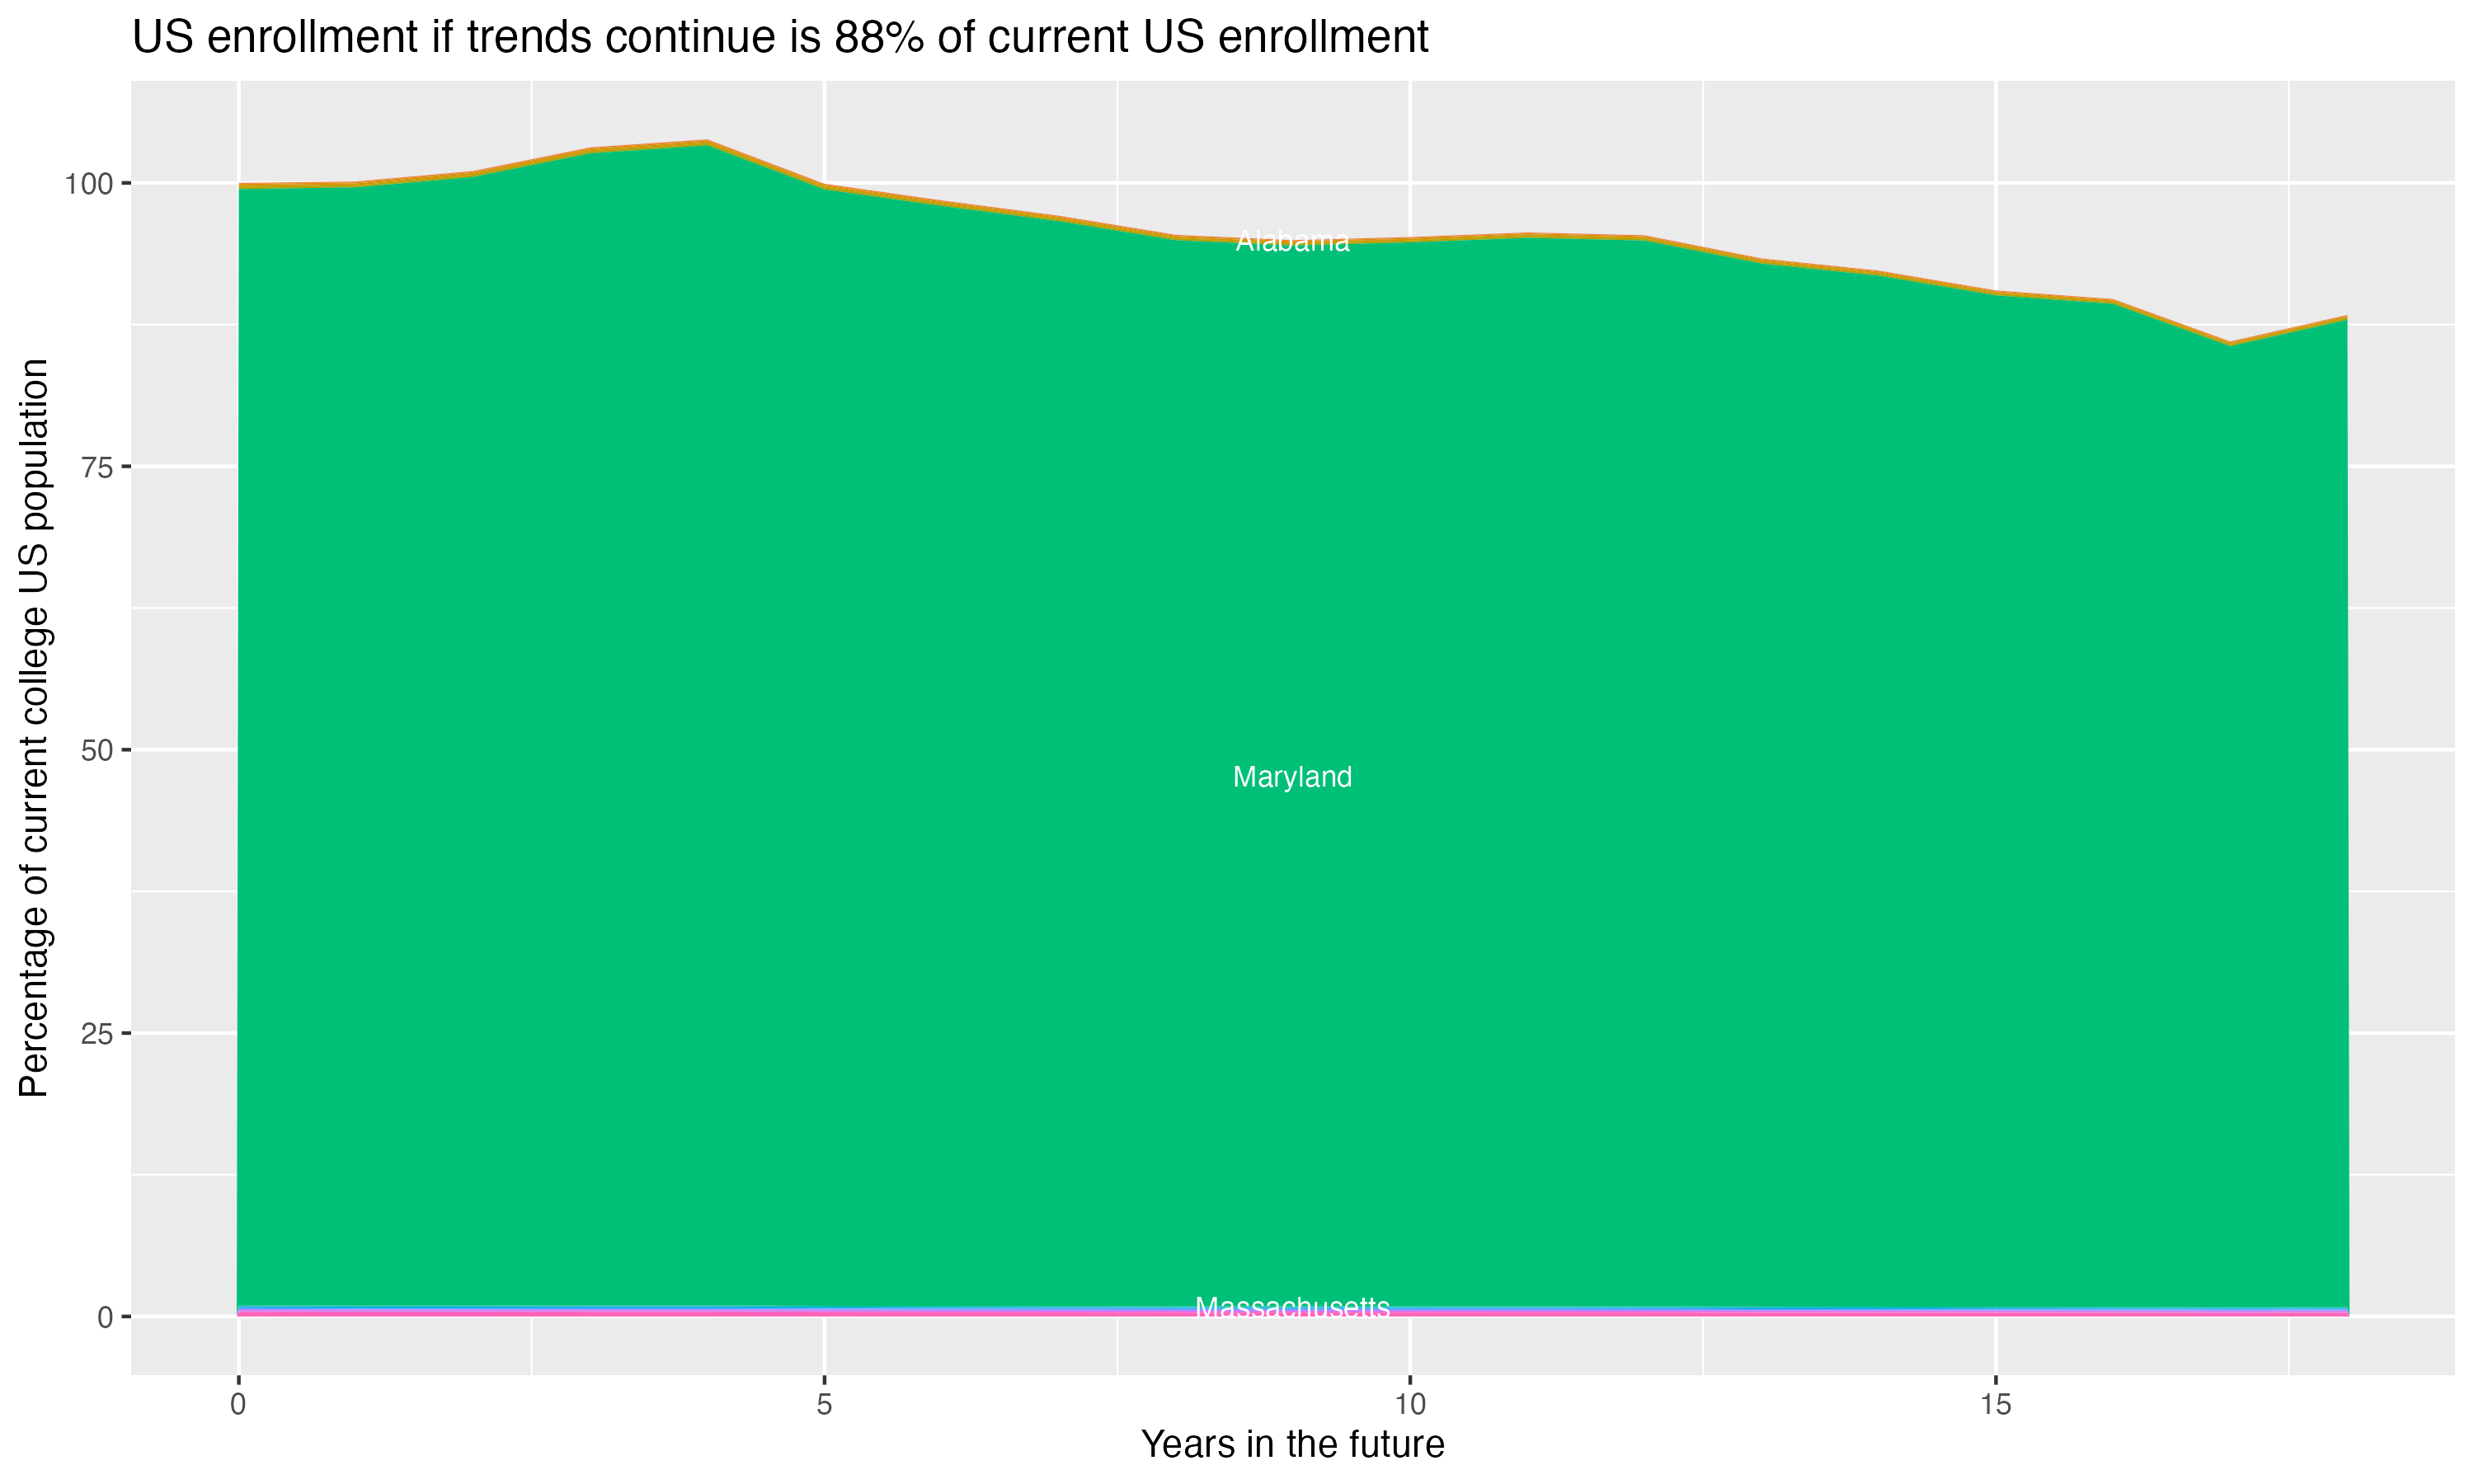
Demographic cliff
There is a concern that giving changing US demographics, the number of students in the age groups who most commonly attend four year colleges will drop off, decreasing overall enrollment. This is often referred to as the “demographic cliff”, and it can be a concern for colleges concerned about the risk of falling enrollment. For this section, the analysis uses US census data on the number of people in each state by age, and the proportion of students that come from each state for this particular college, to crudely model what will happen if everything remains constant except the demographic change in the population of 18 year olds in each year – it does not account for things like the college increasing its admission rate, attracting more students from states without the same demographic changes or from other countries, or changes in the proportion of students who go to college.