North Carolina State University at Raleigh
North Carolina State University at Raleigh is located in Raleigh, North Carolina. It is a public, 4-year or above institution.
From Wikipedia: North Carolina State University (also known as NC State or NCSU) is a public land-grant research university in Raleigh, North Carolina, United States. Founded in 1887 by the North Carolina General Assembly as an agricultural and mechanical college, it is the largest university in the Carolinas and a constituent institution of the University of North Carolina system. Though rooted in its founding land-grant mandate, NC State has grown into a comprehensive university offering degrees in over a hundred fields of study. It maintains historic strengths in science, technology, engineering, and mathematics (STEM), as well as agriculture. It is classified among “R1: Doctoral Universities – Very high research activity”. NC State forms one of the anchors of the Research Triangle alongside Duke University in Durham and the University of North Carolina at Chapel Hill, a geographic region that facilitates collaborative research between the universities and nearby corporate and government partners. NC State’s physical footprint is defined by its red-brick Main Campus, which is centered around the Memorial Belltower. Over the decades, the university has expanded southward into the mixed-use Centennial Campus and Centennial Biomedical Campus. These spaces integrate university research and academic facilities directly with government and corporate partners. The university enrolls nearly 40,000 students. The university’s athletic teams, known as the Wolfpack, compete in NCAA Division I and are founding members of the Atlantic Coast Conference (ACC). The Wolfpack have won six NCAA championships, including men’s basketball and women’s cross-country titles. The university’s alumni include politicians, business leaders, scientists, and professional athletes.
Notes
These are items are unusual or noteworthy.
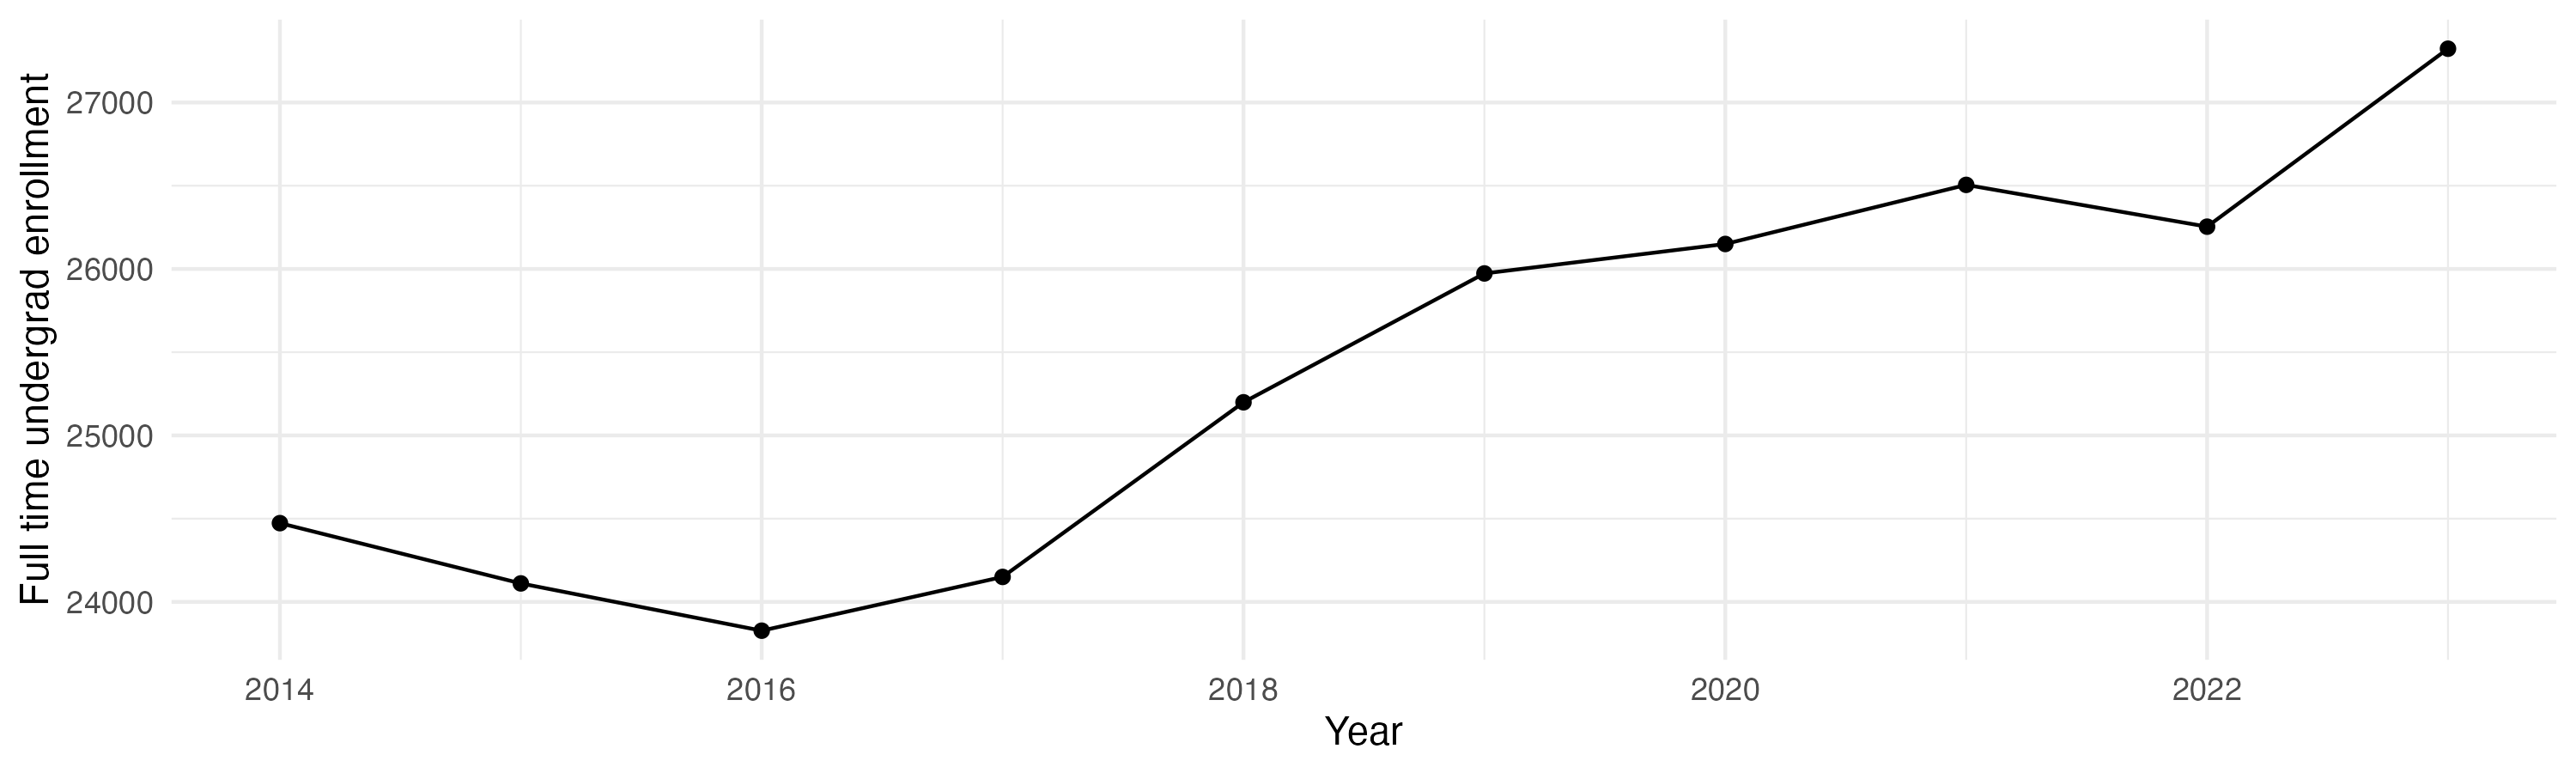
This institution’s full-time undergraduate enrollment has tended to increase over time.
This institution’s endowment has tended to increase over time (this is typically good).
This institution’s ratio of students per tenure-track professor has tended to increase over time (this is generally not ideal: more students per professor so each can get less attention).
Overview of institution
This, and the rest of the page, use info from the most recent year available, generally 2024.
Institution kind: Doctoral Universities: Highest Research Activity
Undergrad program: Professions plus arts & sciences, high graduate coexistence
Graduate program: Research Doctoral: Comprehensive programs, with medical/veterinary school
Enrollment profile: High undergraduate (see more details below)
Average net price for undergrads on financial aid: $14,860 . This is 80% the average cost of Harvard.
Actual price for your family: Go here to see what your family may be asked to pay. It can be MUCH lower than the average price but also higher for some.
Size and setting: Four-year, large, primarily residential
Financial responsibility: No info from US Dept. of Education.
In state percentage: 85% of first year students come from North Carolina
In US percentage: 98% of first year students come from the US
Graduation rate (within 6 years) for students seeking a Bachelors: 85.3% (this is what is usually reported as “graduation rate”)
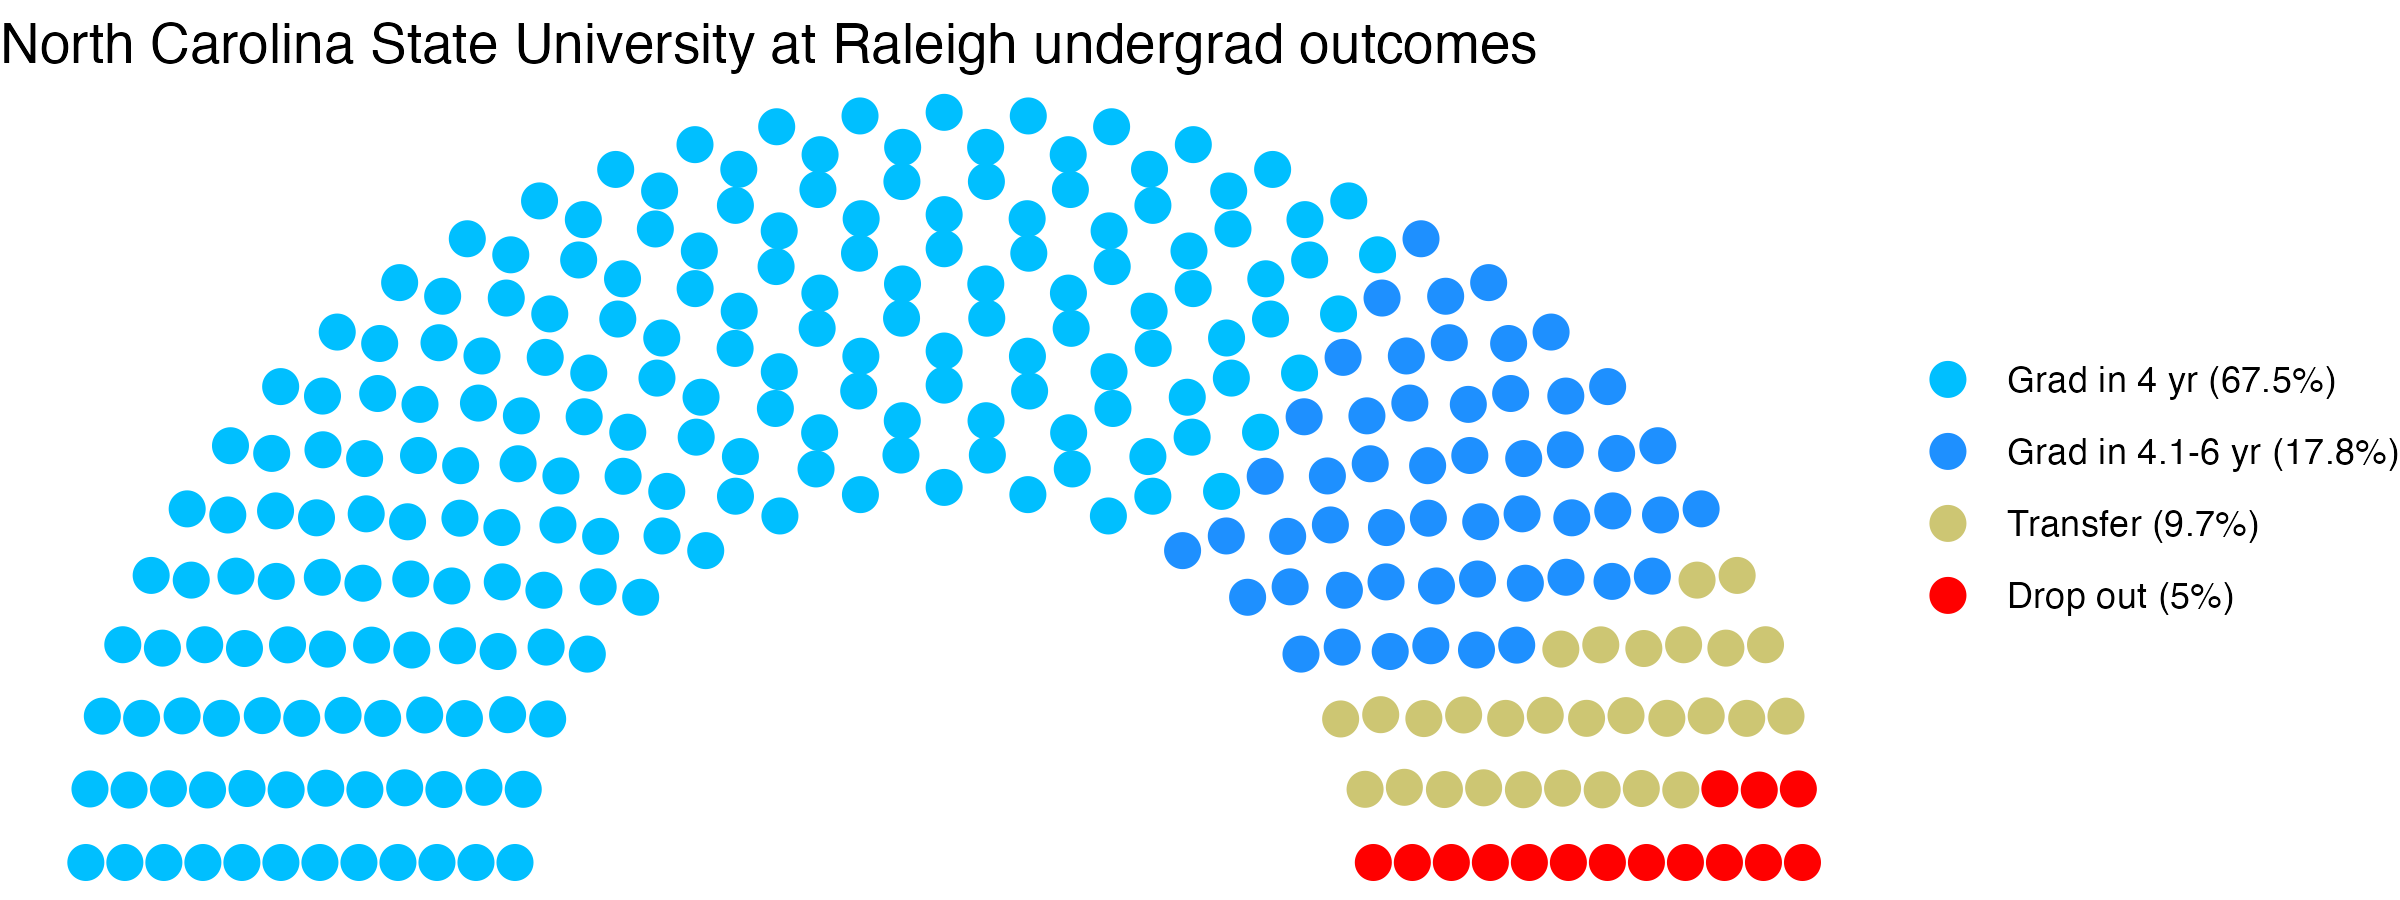
Graduation rate (within 4 years) for students seeking a Bachelors: 67.5%
Percent of students seeking a Bachelors who transfer out of this institution: 9.7%
Student to tenure-stream faculty ratio: 17.4 (undergrads to tenure-stream faculty) [Tenure explained]
Student to faculty ratio: 13.3 (undergrads to all faculty)
Degrees offered: Certificate of less than 1 year, Certificate of at least 12 weeks but less than 1 year, Associate’s degree, Bachelor’s degree, Postbaccalaureate certificate, Master’s degree, Doctor’s degree: research scholarship, Doctor’s degree: professional practice
Schedule: Semester
Institution provides on campus housing: Yes
Dorm capacity: There are enough dorm beds for 9394 students
Freshmen required to live on campus: No
Advanced placement (AP) credits used: Yes
Disabilities: 7.01 percent of undergrads are registered as having disabilities.
Undergrad outcomes
This plot shows the outcomes for first time, full time undergraduates seeking Bachelor’s degrees (if the data are available).
Map
Comparisons
The sections below show this institution compared with others. The ones listed are ones it has identified as peers, who consider themselves peers, and/or who the federal government considers peers. If a comparison school has the same value as the focal school, its cell is grayed out. In fields where there is a common view that higher (or lower) values are better, the best values are in blue, the worst values are in red. If there isn’t a sense of a particular value being better, values are shown in varying shades of green. Arrows show where there is a signficant trend over time for a school. You can swipe across the table to see more of it; the focal school column is always visible.
- North Carolina State University at Raleigh lists these schools as ones to compare itself within federal IPEDS data, and they do the same back: Georgia Institute of Technology-Main Campus, Virginia Polytechnic Institute and State University, Rutgers University-New Brunswick, Iowa State University, Colorado State University-Fort Collins
- North Carolina State University at Raleigh compares itself to these institutions, but not vice versa: University of Florida, University of Wisconsin-Madison, Texas A&M University-College Station, University of Illinois Urbana-Champaign, Ohio State University-Main Campus, University of Maryland-College Park, Purdue University-Main Campus, University of California-Davis, Pennsylvania State University-Main Campus, Michigan State University, University of Arizona
- These institutions compare themselves to North Carolina State University at Raleigh, but not vice versa: Brigham Young University, University of Georgia, Florida State University, University of Central Florida, Clemson University, The University of Tennessee-Knoxville, University of South Florida, Auburn University, University of South Carolina-Columbia, University of Delaware, Texas Tech University, Louisiana State University and Agricultural & Mechanical College, The University of Alabama, Kansas State University, University of Cincinnati-Main Campus, Mississippi State University, Embry-Riddle Aeronautical University-Daytona Beach, George Mason University, University of Maryland-Baltimore County, West Virginia University, CUNY City College, Washington State University, University of Alabama at Birmingham, Embry-Riddle Aeronautical University-Prescott, University of Wyoming, Embry-Riddle Aeronautical University-Worldwide
Enrollment
General
Teaching
Tenure track faculty are those who are eligible for tenure. This includes both pre-tenure and tenured faculty. Once faculty get tenure, they are (generally) protected from being fired for intellectual reasons, helping to ensure their freedom in teaching and research. They can still lose their positions for misconduct, financial problems, not fulfilling their duties, or other reasons.
Non-tenure track faculty are not eligible for tenure. Some are hired one semester at a time, some have multi-year contracts. They typically have a higher teaching load than tenure track faculty, leaving less time for research or other creative endeavors. They are also easier to fire than tenured faculty. Sometimes they are external experts (a noted musician, a former senator) who are hired to teach some classes without the expected permanence of a tenure-track position.
Note that this chart uses US federal demographic data: it only has two genders and a specified set of ethnicities and races.
Having a low student to faculty ratio is considered a good thing by many, as it can mean more individual attention.
Geography
This has information on the location of the institution. See the about page for more information on what the metrics are and how they are calculated.
Financial Aid
Graduation
Note these are bachelors graduation rates in six years, not four (this is standard). Sample sizes can be small for some demographic groups with few individuals in a school, leading to large year-to-year fluctuations and often extreme values for those groups (if there are two individuals in the class with a given identity, the possible graduation rates are 0%, 50%, or 100% depending on whether zero, one, or both students graduate within six years).
Institution finances
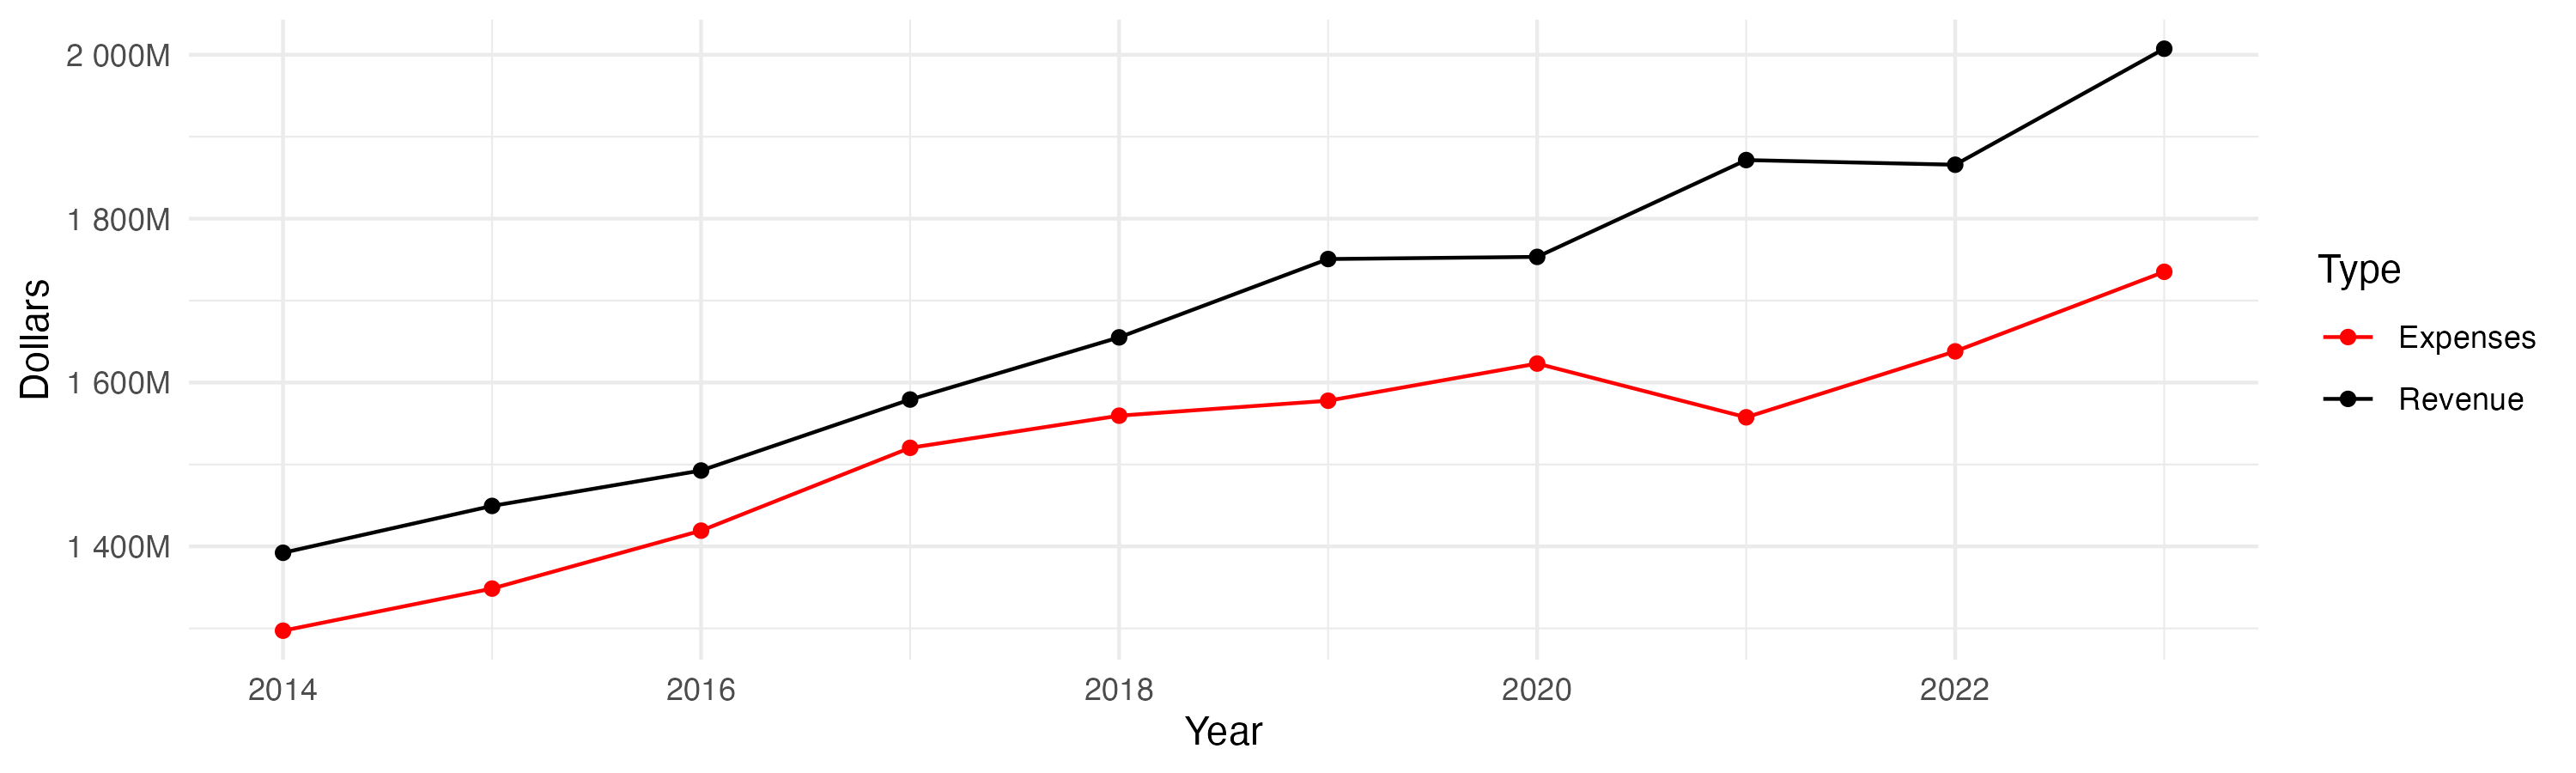
Many colleges are facing enrollment declines (see also the “Demographic cliff” section), which affects revenue, especially for ones that get revenue primarily from tuition. Some public institutions have also had a decrease of government support over the years. In addition to the information here, this article has information on finances by college. The plot below shows revenue (black) and expenses (red) over time. Note that some colleges had unusual expenses during the peak of the covid pandemic in 2020 and 2021.
Expense distribution
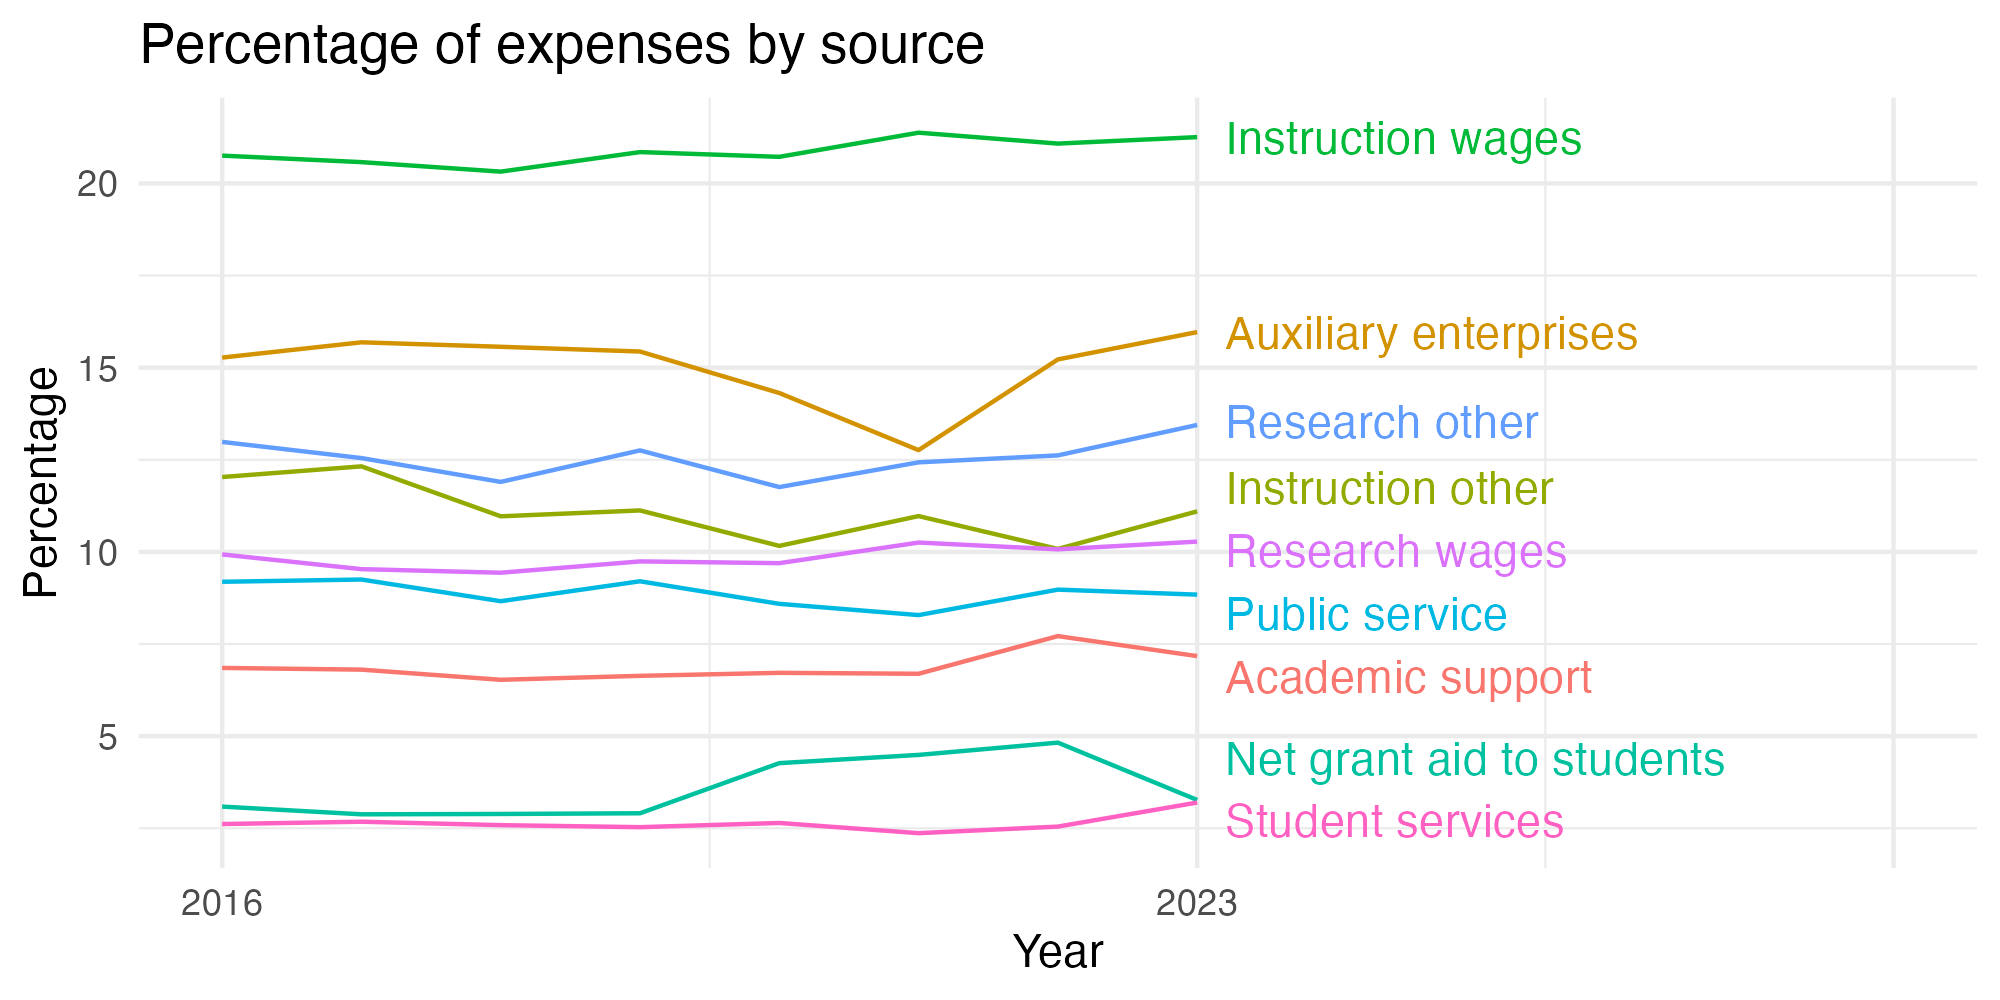
Colleges have various expenses, and the share of those has changed through time. A recent (July 1, 2026) article suggested that faculty salaries tend to be decreasing as a component of all college expenses. This plot (if data are available) shows wages and salaries used for instruction (which include faculty and others supporting instruction), other instructional costs, and other costs as a percentage of a college’s overall reported expenses each year. “Auxiliary enterprises” can include the cost of running student housing, food services, student health services, and other costs. Athletics can be accounted within “student services” or “auxiliary enterprises”.
Library
Libraries are changing rapidly. Note that how institutions count digital collections may vary.
Diversity
The US Census Bureau has a diversity index that goes from 0 to 1. In their words, “A 0-value indicates that everyone in the population has the same racial and ethnic characteristics. A value close to 1 indicates that everyone in the population has different racial and ethnic characteristics.” This uses their formula, but with the resolution available for the federal IPEDS data (which does not separate for a given demographic group whether members identify as Hispanic or not). This metric is about heterogeneity within the population, not the proportion of the population that comes from historically excluded groups.
Following the practice of the census, the index is multiplied by 100 to give the percentage probability a random pair of individuals will have a different background. Most institutions argue that diversity is a benefit, so by default a higher number is listed as better, but there may be cases where this measure does not reflect the mission of a college (for example, 70% of the students at a tribal college or university may be American Indian: that could be low-scoring by this metric but should not be read as “bad” given the institution’s mission).
These numbers are based on the most recent year available, generally 2024, which predates effects of the US Supreme Court’s striking down of affirmative action. This has often changed, sometimes dramatically, the incoming student demographics at some institutions.
Overall diversity
Freshman profile
Demographic data for first time degree-seeking students. Note that this uses US federal demographic data: it only has two genders and a specified set of ethnicities and races.
Freshman geography
Test scores
SAT scores
ACT scores
Majors
This presents information on the number of majors and the median earnings one and five years after graduation for people who got a degree from this institution in that field. The earnings are for those who are working and not enrolled in further education. The earnings data (from the federal college scorecard) also has information on earnings for those categorized as ‘MALE’ and ‘NOMALE’ – for readability, these are recategorized here as “Men” and “Women”, respectively, which adopts the gender binary used in other federal data. “W/M earnings ratio” is the median earnings of women divided by men, as a percentage.
Bachelors
Masters
Doctorate
Certificate
Associates
Demographic cliff
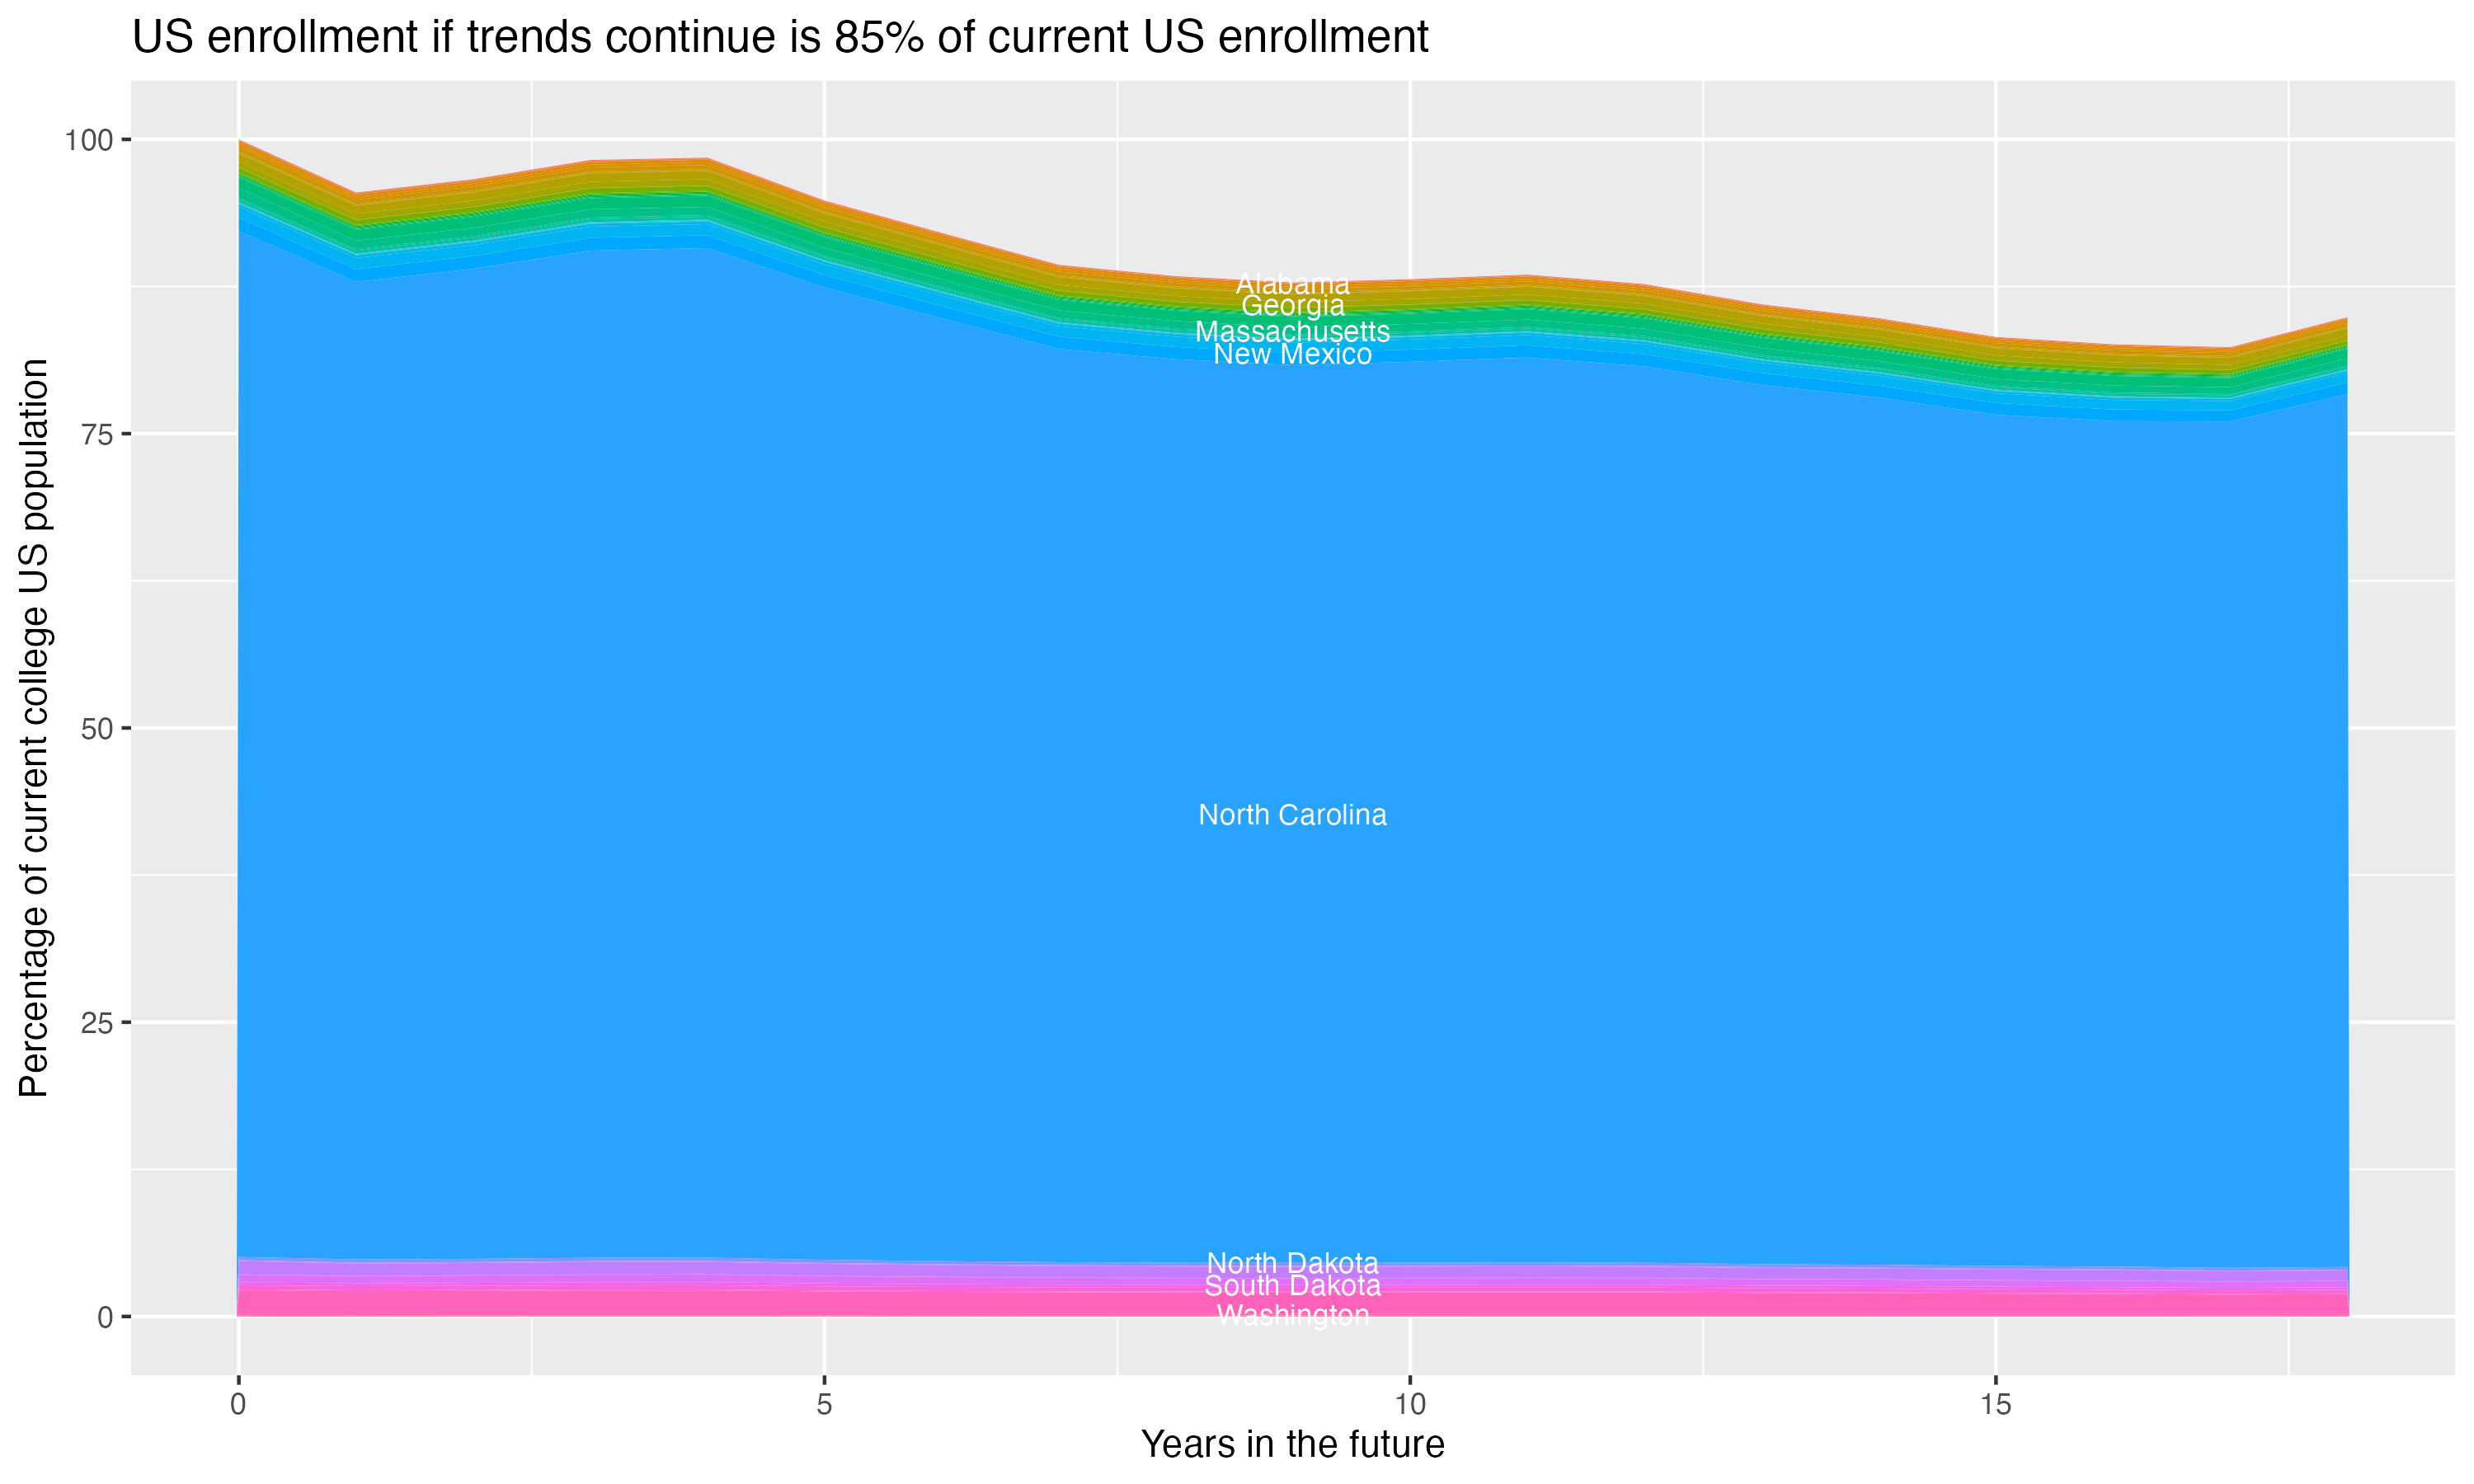
There is a concern that giving changing US demographics, the number of students in the age groups who most commonly attend four year colleges will drop off, decreasing overall enrollment. This is often referred to as the “demographic cliff”, and it can be a concern for colleges concerned about the risk of falling enrollment. For this section, the analysis uses US census data on the number of people in each state by age, and the proportion of students that come from each state for this particular college, to crudely model what will happen if everything remains constant except the demographic change in the population of 18 year olds in each year – it does not account for things like the college increasing its admission rate, attracting more students from states without the same demographic changes or from other countries, or changes in the proportion of students who go to college.