College of Charleston
College of Charleston is located in Charleston, South Carolina. It is a public, 4-year or above institution.
From Wikipedia: The College of Charleston (CofC or Charleston) is a public university in Charleston, South Carolina, United States. Founded in 1770 and chartered in 1785, it is the oldest university in South Carolina, the 13th-oldest institution of higher learning in the United States, and the country’s oldest municipal college. The founders of the College of Charleston included six Founding Fathers of the United States, including three who signed the Declaration of Independence (Thomas Heyward Jr., Arthur Middleton, and Edward Rutledge) and three who signed the Constitution of the United States (Charles Pinckney, Charles Cotesworth Pinckney, and John Rutledge).
Overview of institution
This, and the rest of the page, use info from the most recent year available, generally 2024.
Institution kind: Master’s Colleges & Universities: Medium Programs
Undergrad program: Balanced arts & sciences/professions, some graduate coexistence
Graduate program: Postbaccalaureate: Business-dominant, with Arts & Sciences
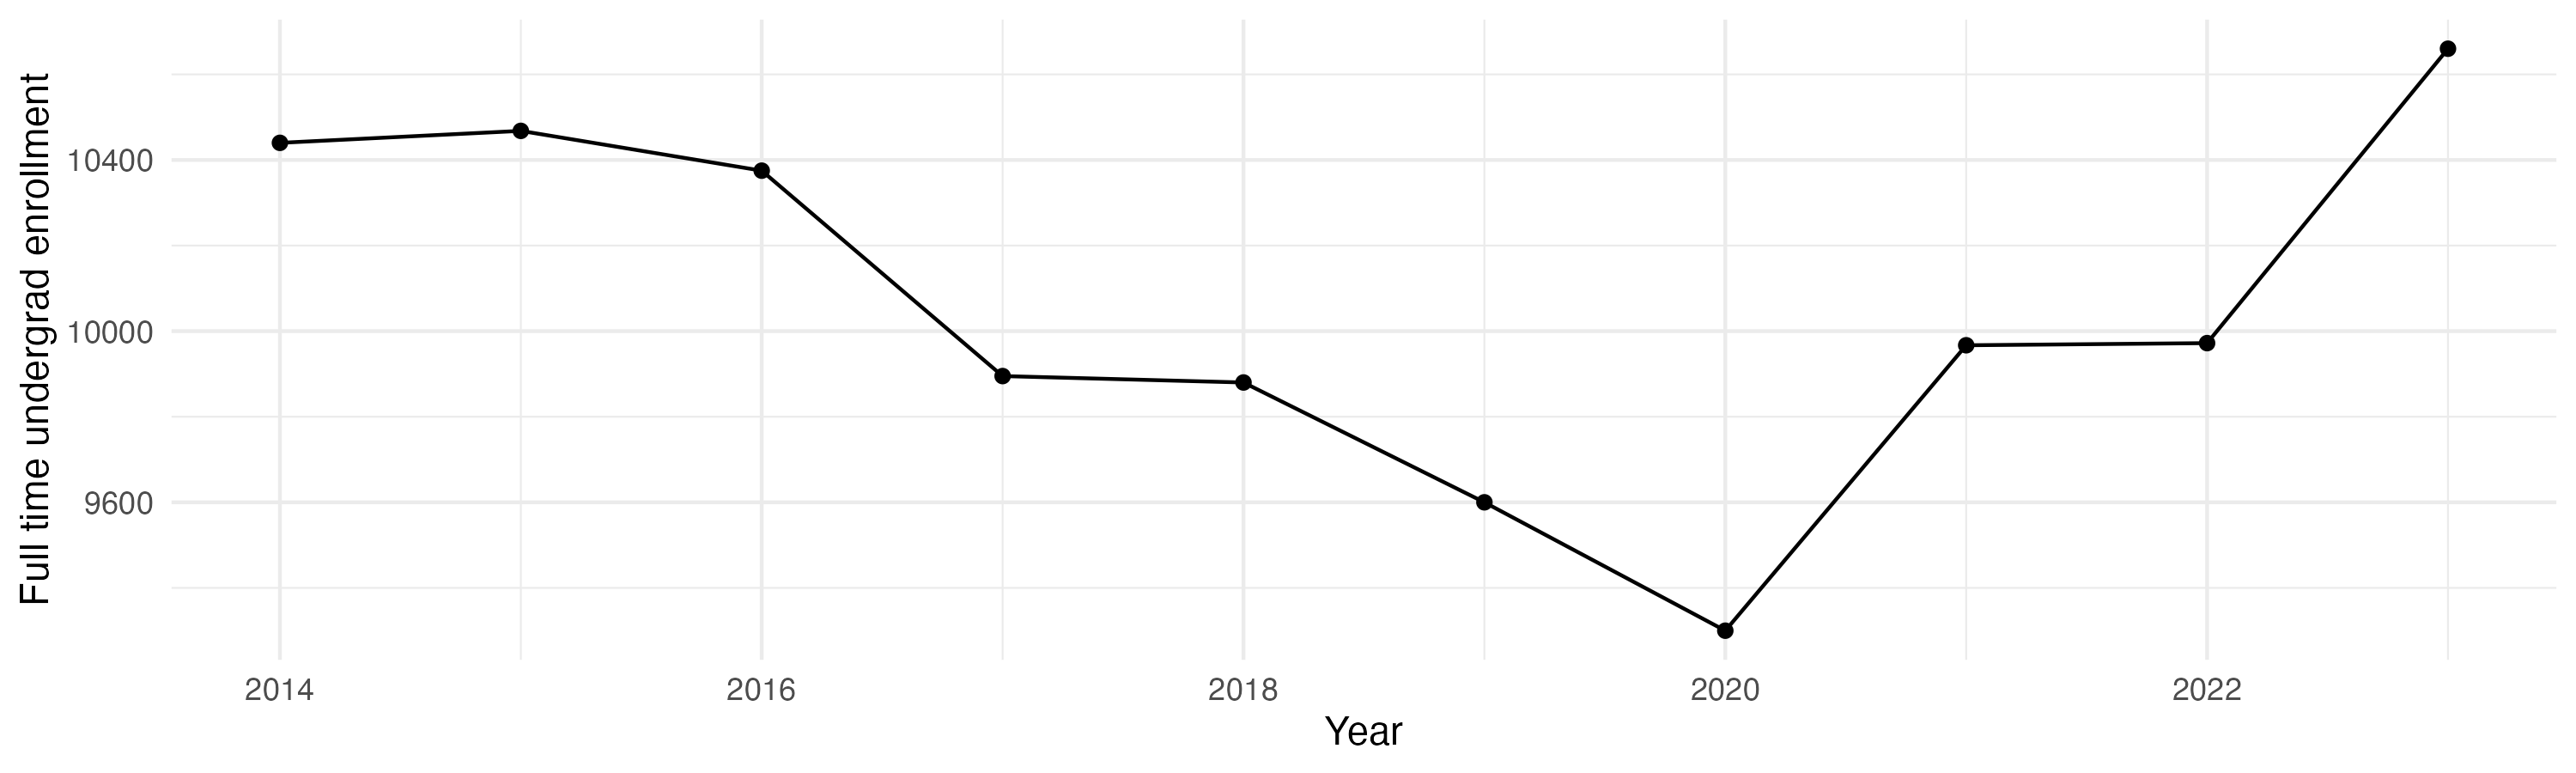
Enrollment profile: Very high undergraduate (see more details below)
Average net price for undergrads on financial aid: $20,806 (1.2 times the equivalent cost of Harvard).
Actual price for your family: Go here to see what your family may be asked to pay. It can be MUCH lower than the average price but also higher for some.
Size and setting: Four-year, medium, primarily residential
In state percentage: 38% of first year students come from South Carolina
In US percentage: 99% of first year students come from the US
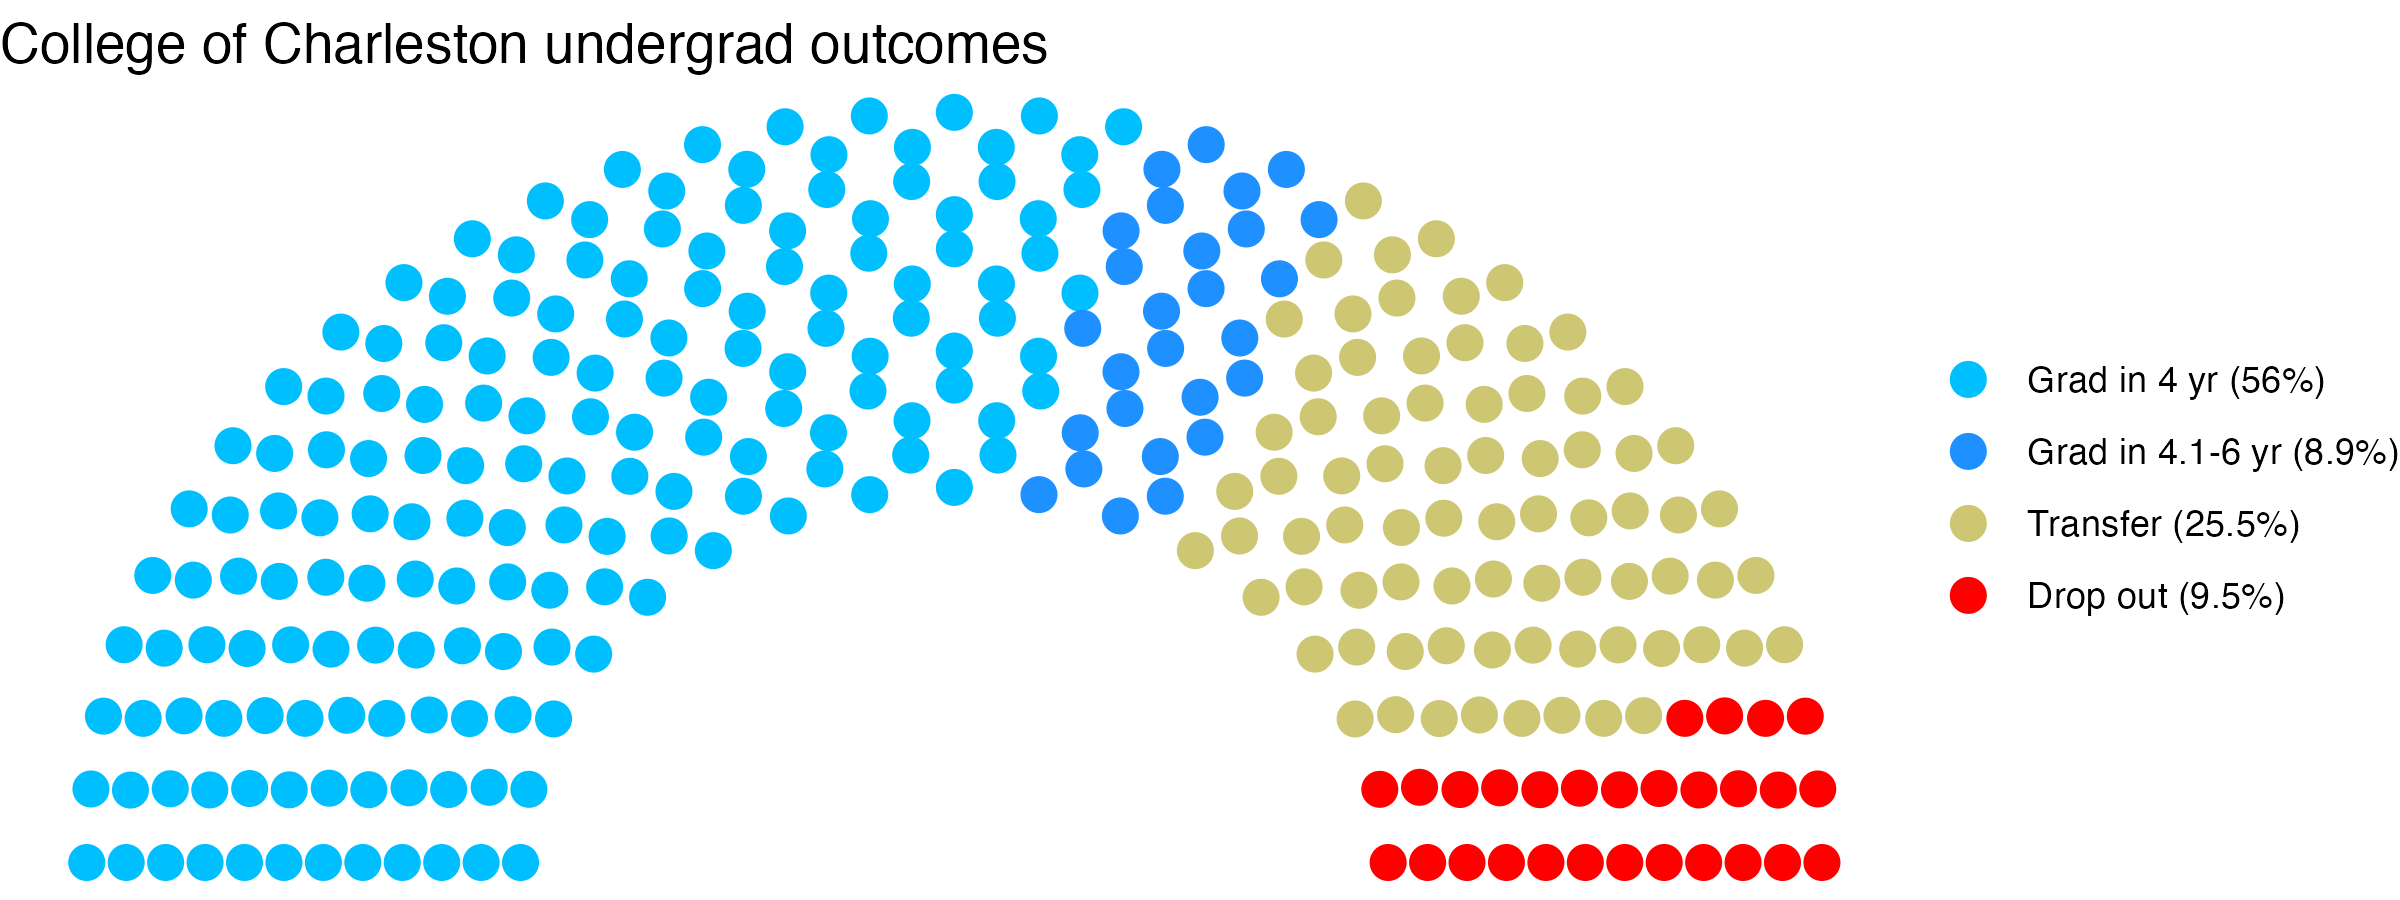
Graduation rate (within 6 years) for students seeking a Bachelors: 65% (this is what is usually reported as “graduation rate”)
Graduation rate (within 4 years) for students seeking a Bachelors: 56%
Percent of students seeking a Bachelors who transfer out of this institution: 25.5%
Student to tenure-stream faculty ratio: 23.4 (undergrads to tenure-stream faculty) [Tenure explained]
Student to faculty ratio: 18.9 (undergrads to all faculty)
Degrees offered: Certificate of less than 1 year, Certificate of at least 12 weeks but less than 1 year, Bachelor’s degree, Postbaccalaureate certificate, Master’s degree, Post master’s certificate, Doctor’s degree: research scholarship
Schedule: Semester
Institution provides on campus housing: Yes
Dorm capacity: There are enough dorm beds for 3097 students
Freshmen required to live on campus: No
Advanced placement (AP) credits used: Yes
Disabilities: 12.00 percent of undergrads are registered as having disabilities.
Undergrad outcomes
This plot shows the outcomes for first time, full time undergraduates seeking Bachelor’s degrees (if the data are available).
Map
Comparisons
The sections below show this institution compared with others. The ones listed are ones it has identified as peers, who consider themselves peers, and/or who the federal government considers peers. If a comparison school has the same value as the focal school, its cell is grayed out. In fields where there is a common view that higher (or lower) values are better, the best values are in blue, the worst values are in red. If there isn’t a sense of a particular value being better, values are shown in varying shades of green. Arrows show where there is a signficant trend over time for a school. You can swipe across the table to see more of it; the focal school column is always visible.
- College of Charleston lists these schools as ones to compare itself within federal IPEDS data, and they do the same back: James Madison University, The University of Tampa, University of North Carolina Wilmington, Elon University, University of Wisconsin-Eau Claire, Appalachian State University, The University of Tennessee-Chattanooga, Western Washington University, University of Northern Iowa, University of Minnesota-Duluth, Eastern Kentucky University, Southeastern Louisiana University, University of Mary Washington, William Paterson University of New Jersey, Florida Gulf Coast University
- College of Charleston compares itself to these institutions, but not vice versa: CUNY Bernard M Baruch College, University of Wisconsin-La Crosse, University of North Florida, West Chester University of Pennsylvania, University of West Georgia, CUNY John Jay College of Criminal Justice, CUNY City College, Rowan University, CUNY Brooklyn College, CUNY Queens College, Texas Southmost College, Arkansas State University, CUNY Lehman College, University of Wisconsin-Whitewater, University of Central Oklahoma, University of Central Missouri, University of Alaska Anchorage, Tennessee Technological University, Minnesota State University-Mankato, Youngstown State University, Central Connecticut State University, Ferris State University, Southeast Missouri State University, Murray State University, Fort Hays State University, University of Central Arkansas, Tarleton State University, University of Wisconsin-Oshkosh, Western Carolina University, Kean University, California State University-Chico, Bridgewater State University, Stephen F Austin State University, Marshall University, Central Washington University, Southern Connecticut State University, Valdosta State University, California State University-San Bernardino, Austin Peay State University, Western Illinois University, Southern Illinois University Edwardsville, California State University-San Marcos, Troy University, Arkansas Tech University, Morehead State University, Eastern Washington University, Northern Kentucky University, College of Staten Island CUNY, California State University-Dominguez Hills, SUNY Buffalo State University, Saint Cloud State University, Purdue University Fort Wayne, University of Colorado Colorado Springs, Empire State University, California State University-East Bay, Northeastern Illinois University
- These institutions compare themselves to College of Charleston, but not vice versa: Samford University, Georgia Southern University, Grand Valley State University, Stockton University, Georgia College & State University, Belmont University, Truman State University, SUNY Brockport, University of Louisiana at Monroe, Coastal Carolina University, Winthrop University, University of Wisconsin-River Falls, Rutgers University-Camden, Queens University of Charlotte, Citadel Military College of South Carolina, University of Illinois Springfield, University of South Carolina Aiken, New College of Florida, Metropolitan State University of Denver, Lenoir-Rhyne University, University of Pittsburgh-Johnstown, Spartanburg Methodist College
Enrollment
General
Teaching
Tenure track faculty are those who are eligible for tenure. This includes both pre-tenure and tenured faculty. Once faculty get tenure, they are (generally) protected from being fired for intellectual reasons, helping to ensure their freedom in teaching and research. They can still lose their positions for misconduct, financial problems, not fulfilling their duties, or other reasons.
Non-tenure track faculty are not eligible for tenure. Some are hired one semester at a time, some have multi-year contracts. They typically have a higher teaching load than tenure track faculty, leaving less time for research or other creative endeavors. They are also easier to fire than tenured faculty. Sometimes they are external experts (a noted musician, a former senator) who are hired to teach some classes without the expected permanence of a tenure-track position.
Note that this chart uses US federal demographic data: it only has two genders and a specified set of ethnicities and races.
Having a low student to faculty ratio is considered a good thing by many, as it can mean more individual attention.
Geography
This has information on the location of the institution. See the about page for more information on what the metrics are and how they are calculated.
Financial Aid
Graduation
Note these are bachelors graduation rates in six years, not four (this is standard). Sample sizes can be small for some demographic groups with few individuals in a school, leading to large year-to-year fluctuations and often extreme values for those groups (if there are two individuals in the class with a given identity, the possible graduation rates are 0%, 50%, or 100% depending on whether zero, one, or both students graduate within six years).
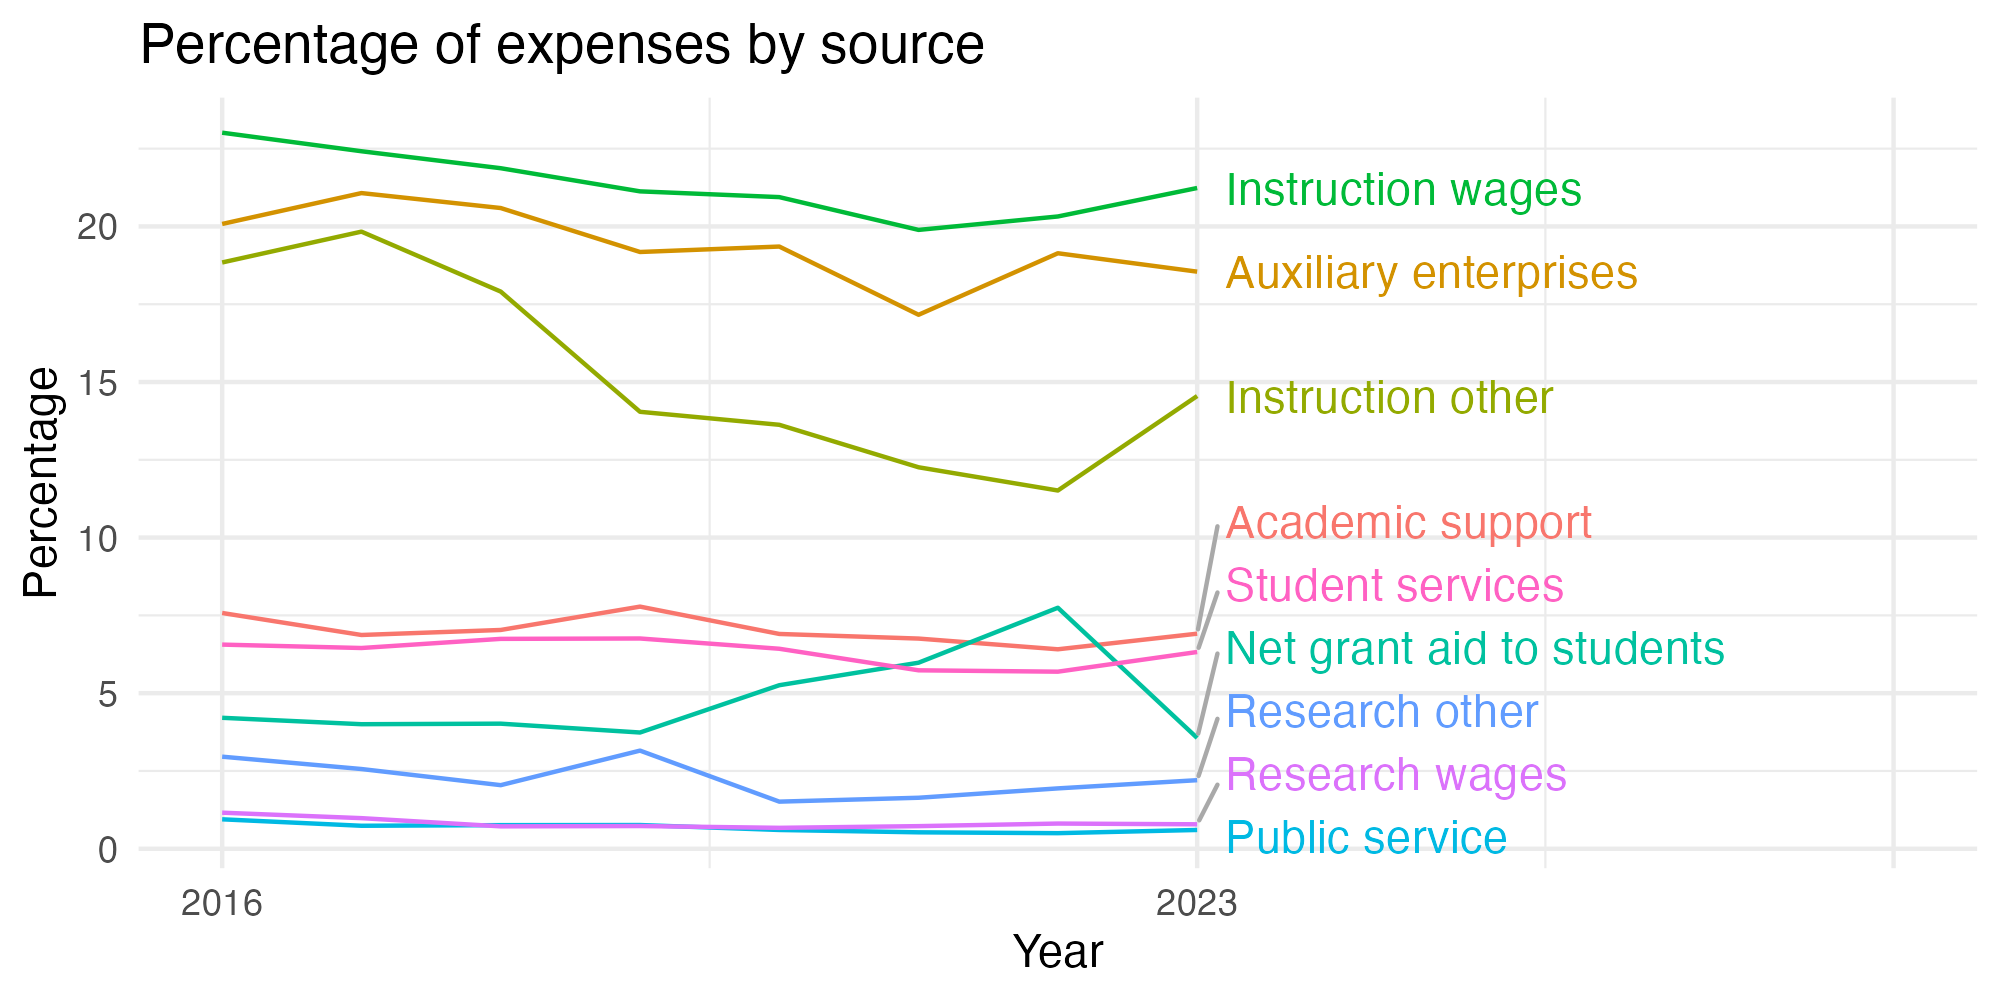
Expense distribution
Colleges have various expenses, and the share of those has changed through time. A recent (July 1, 2026) article suggested that faculty salaries tend to be decreasing as a component of all college expenses. This plot (if data are available) shows wages and salaries used for instruction (which include faculty and others supporting instruction), other instructional costs, and other costs as a percentage of a college’s overall reported expenses each year.
Library
Libraries are changing rapidly. Note that how institutions count digital collections may vary.
Diversity
The US Census Bureau has a diversity index that goes from 0 to 1. In their words, “A 0-value indicates that everyone in the population has the same racial and ethnic characteristics. A value close to 1 indicates that everyone in the population has different racial and ethnic characteristics.” This uses their formula, but with the resolution available for the federal IPEDS data (which does not separate for a given demographic group whether members identify as Hispanic or not). This metric is about heterogeneity within the population, not the proportion of the population that comes from historically excluded groups.
Following the practice of the census, the index is multiplied by 100 to give the percentage probability a random pair of individuals will have a different background. Most institutions argue that diversity is a benefit, so by default a higher number is listed as better, but there may be cases where this measure does not reflect the mission of a college (for example, 70% of the students at a tribal college or university may be American Indian: that could be low-scoring by this metric but should not be read as “bad” given the institution’s mission).
These numbers are based on the most recent year available, generally 2024, which predates effects of the US Supreme Court’s striking down of affirmative action. This has often changed, sometimes dramatically, the incoming student demographics at some institutions.
Overall diversity
Freshman profile
Demographic data for first time degree-seeking students. Note that this uses US federal demographic data: it only has two genders and a specified set of ethnicities and races.
Freshman geography
Test scores
SAT scores
ACT scores
Majors
This presents information on the number of majors and the median earnings one and five years after graduation for people who got a degree from this institution in that field. The earnings are for those who are working and not enrolled in further education. The earnings data (from the federal college scorecard) also has information on earnings for those categorized as ‘MALE’ and ‘NOMALE’ – for readability, these are recategorized here as “Men” and “Women”, respectively, which adopts the gender binary used in other federal data. “W/M earnings ratio” is the median earnings of women divided by men, as a percentage.
Bachelors
Masters
Doctorate
Certificate
Associates
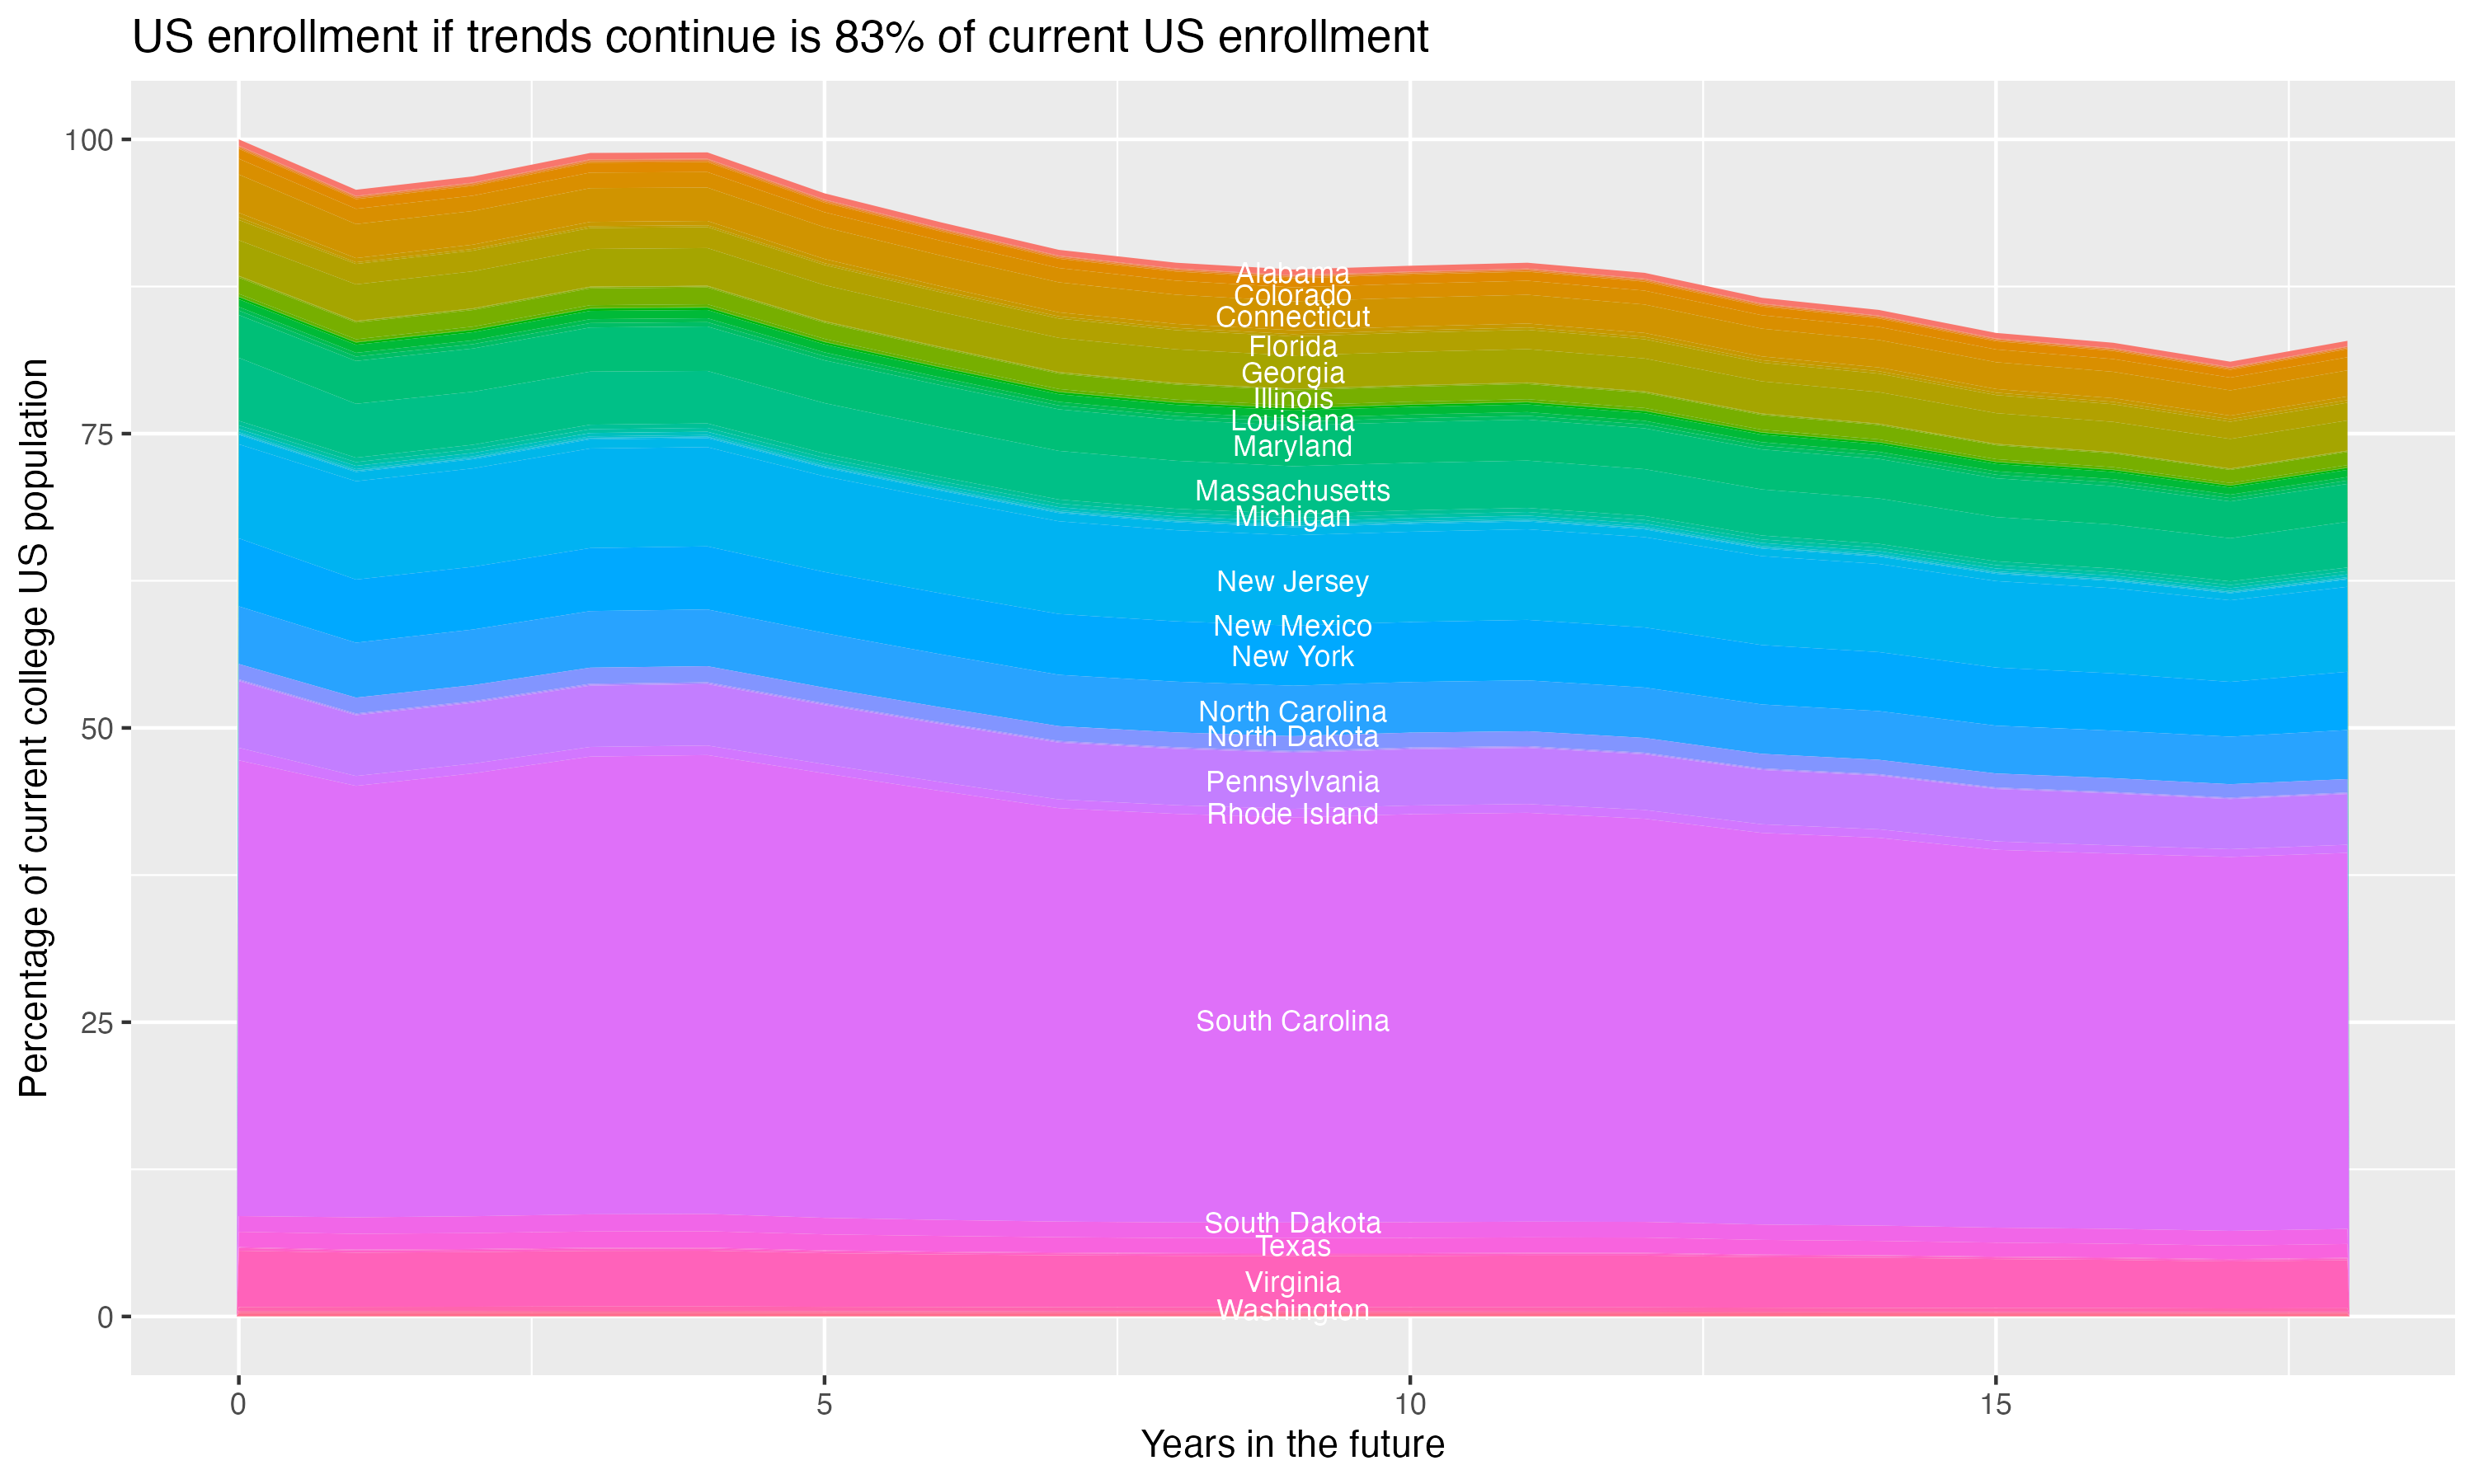
Demographic cliff
There is a concern that giving changing US demographics, the number of students in the age groups who most commonly attend four year colleges will drop off, decreasing overall enrollment. This is often referred to as the “demographic cliff”, and it can be a concern for colleges concerned about the risk of falling enrollment. For this section, the analysis uses US census data on the number of people in each state by age, and the proportion of students that come from each state for this particular college, to crudely model what will happen if everything remains constant except the demographic change in the population of 18 year olds in each year – it does not account for things like the college increasing its admission rate, attracting more students from states without the same demographic changes or from other countries, or changes in the proportion of students who go to college.