Trinity University
Trinity University is located in San Antonio, Texas. It is a private not-for-profit, 4-year or above institution.
From Wikipedia: Trinity University is a private liberal arts college in San Antonio, Texas. It was founded as a coeducational institution in 1869 by Cumberland Presbyterians as the merger of three schools whose enrollment had dropped during the Civil War. Its first campus in Tehuacana was built on 1,100 acres (450 ha) of land donated by John Boyd. The school moved its campus to Waxahachie in 1902, and finally, San Antonio in 1945. Trinity’s 125-acre (51 ha) campus, built atop a former lime quarry, is located north of downtown San Antonio, between the Monte Vista Historic District to the west and Olmos Park to the north. Designed by O’Neil Ford, the campus has been designated a National Historic Landmark District. There are 288 faculty members, with a student-to-faculty ratio of 8:1. As of 2024, the university had an enrollment of 2,490 undergraduate students and 143 graduate students. Following a liberal arts and sciences curriculum, Trinity University’s four schools offer 57 majors, 63 minors, and 6 graduate programs. The diverse student body represents 47 United States states and 58 countries. Students participate in over 100 student organizations, including the campus newspaper, Trinitonian, and the campus radio station, KRTU-FM. The Trinity Tigers compete in the NCAA Division III Southern Athletic Association.
Overview of institution
This, and the rest of the page, use info from the most recent year available, generally 2024.
Institution kind: Baccalaureate Colleges: Arts & Sciences Focus
Undergrad program: Arts & sciences plus professions, some graduate coexistence
Graduate program: Postbaccalaureate: Education-dominant, with other professional programs
Enrollment profile: Very high undergraduate (see more details below)
Average net price for undergrads on financial aid: $32,264 (1.8 times the equivalent cost of Harvard).
Actual price for your family: Go here to see what your family may be asked to pay. It can be MUCH lower than the average price but also higher for some.
Size and setting: Four-year, small, highly residential
In state percentage: 80% of first year students come from Texas
In US percentage: 95% of first year students come from the US
This institution has a religious affiliation of Presbyterian Church (USA)
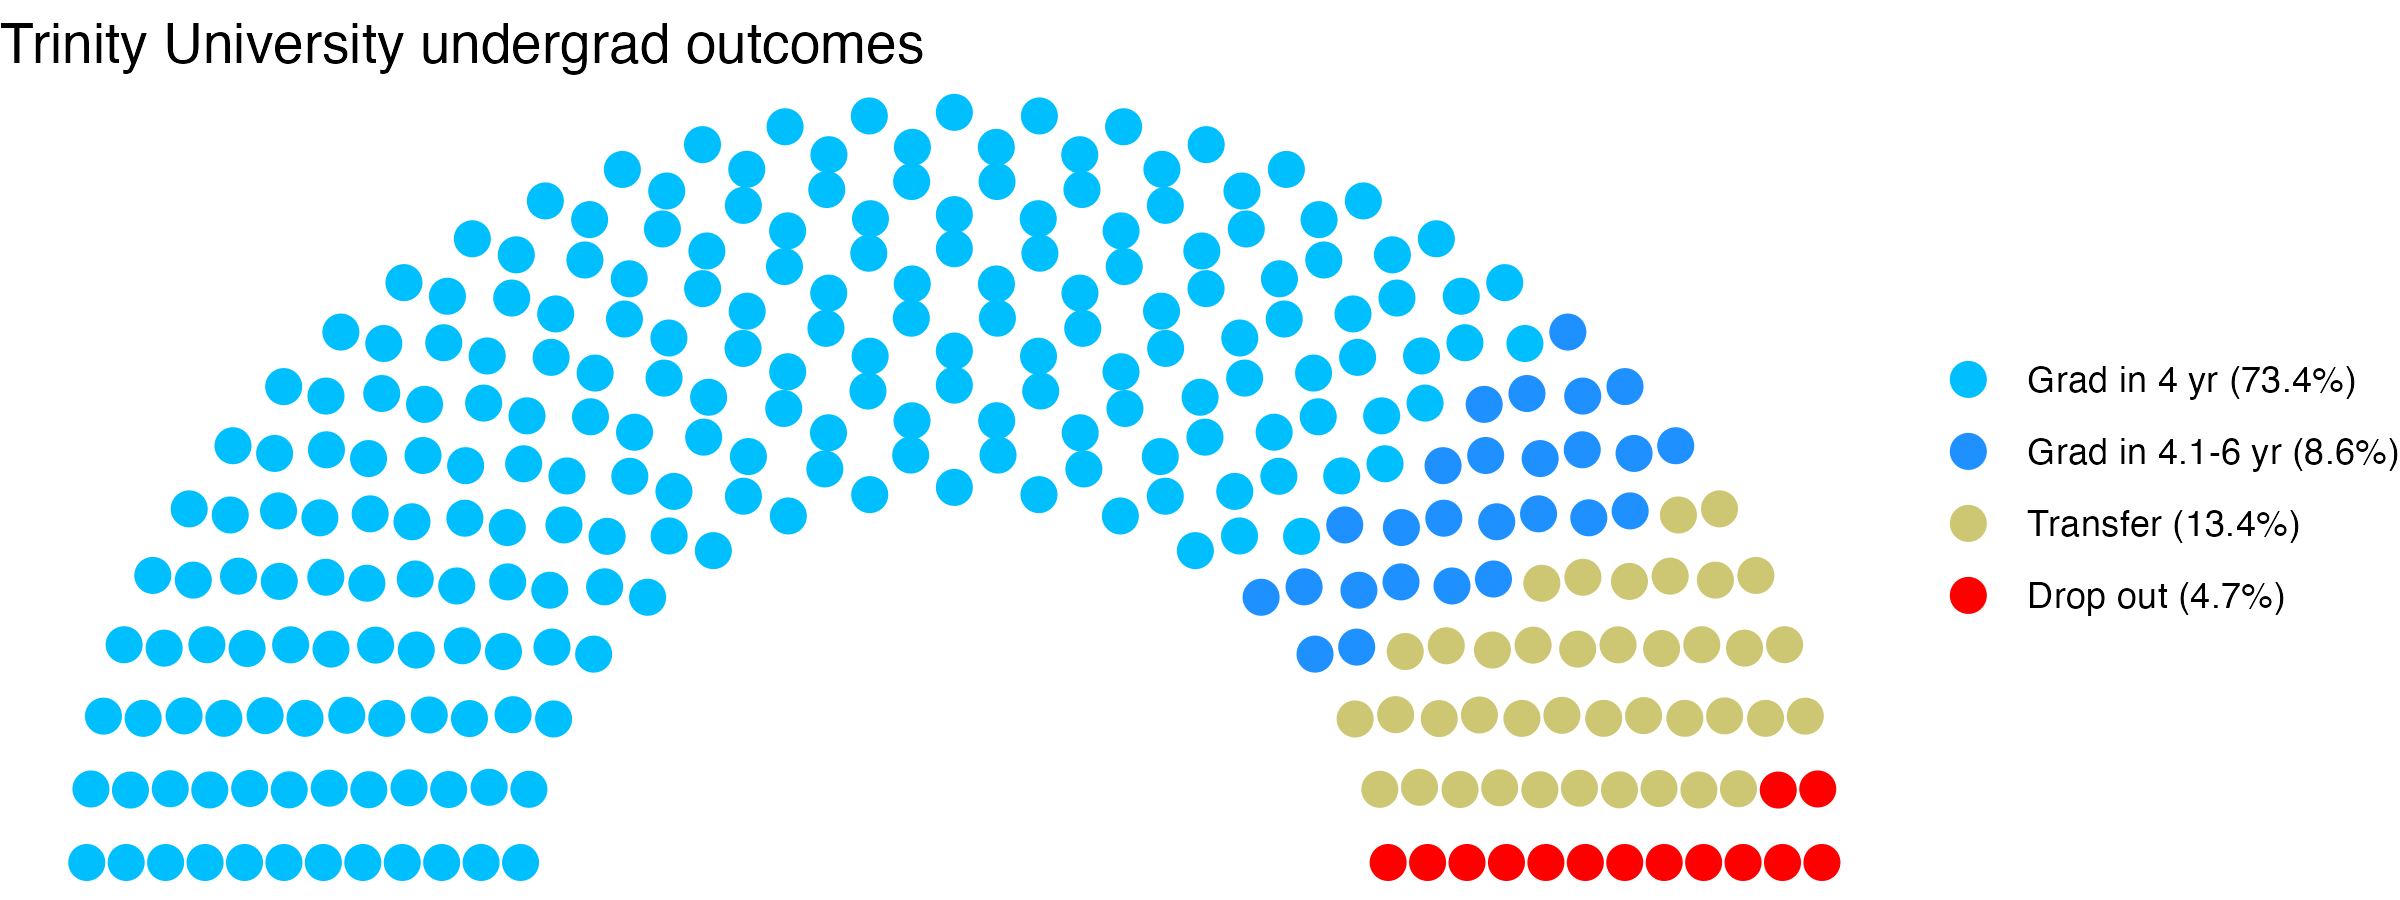
Graduation rate (within 6 years) for students seeking a Bachelors: 81.9% (this is what is usually reported as “graduation rate”)
Graduation rate (within 4 years) for students seeking a Bachelors: 73.4%
Percent of students seeking a Bachelors who transfer out of this institution: 13.4%
Student to tenure-stream faculty ratio: 11.3 (undergrads to tenure-stream faculty) [Tenure explained]
Student to faculty ratio: 9.1 (undergrads to all faculty)
Degrees offered: Bachelor’s degree, Master’s degree
Schedule: Semester
Institution provides on campus housing: Yes
Dorm capacity: There are enough dorm beds for 2038 students
Freshmen required to live on campus: No
Advanced placement (AP) credits used: Yes
Disabilities: 21.00 percent of undergrads are registered as having disabilities.
Undergrad outcomes
This plot shows the outcomes for first time, full time undergraduates seeking Bachelor’s degrees (if the data are available).
Map
Comparisons
The sections below show this institution compared with others. The ones listed are ones it has identified as peers, who consider themselves peers, and/or who the federal government considers peers. If a comparison school has the same value as the focal school, its cell is grayed out. In fields where there is a common view that higher (or lower) values are better, the best values are in blue, the worst values are in red. If there isn’t a sense of a particular value being better, values are shown in varying shades of green. Arrows show where there is a signficant trend over time for a school. You can swipe across the table to see more of it; the focal school column is always visible.
- Trinity University lists these schools as ones to compare itself within federal IPEDS data, and they do the same back: University of Richmond, Rollins College, Furman University, Southwestern University, Hendrix College, Morehouse College, University of Dallas, Centenary College of Louisiana, Millsaps College
- Trinity University compares itself to these institutions, but not vice versa: Rice University, Bowdoin College, Williams College, Colby College, Pomona College, Wellesley College, Swarthmore College, Davidson College, Amherst College, Washington and Lee University, Wesleyan University, Bates College, Smith College, Grinnell College, Carleton College, Colorado College, Bucknell University, Texas Christian University, Denison University, Macalester College, Baylor University, Trinity College, Oberlin College, Spelman College, St Olaf College, Southern Methodist University, Reed College, Rhodes College, The University of the South, Centre College, DePauw University, The College of Wooster, Lawrence University, Austin College, Lewis & Clark College, Beloit College
- These institutions compare themselves to Trinity University, but not vice versa: The University of Tampa, Brigham Young University-Hawaii, Newman University, Butler University, Florida Southern College, Christopher Newport University, Abilene Christian University, Agnes Scott College, University of Puget Sound, Longwood University, Loyola University New Orleans, Saint Edward’s University, University of Illinois Springfield, Lubbock Christian University, St. Mary’s University, University of Mary Hardin-Baylor, Indiana Wesleyan University-Marion, Paul Quinn College, Houston Christian University, Tiffin University
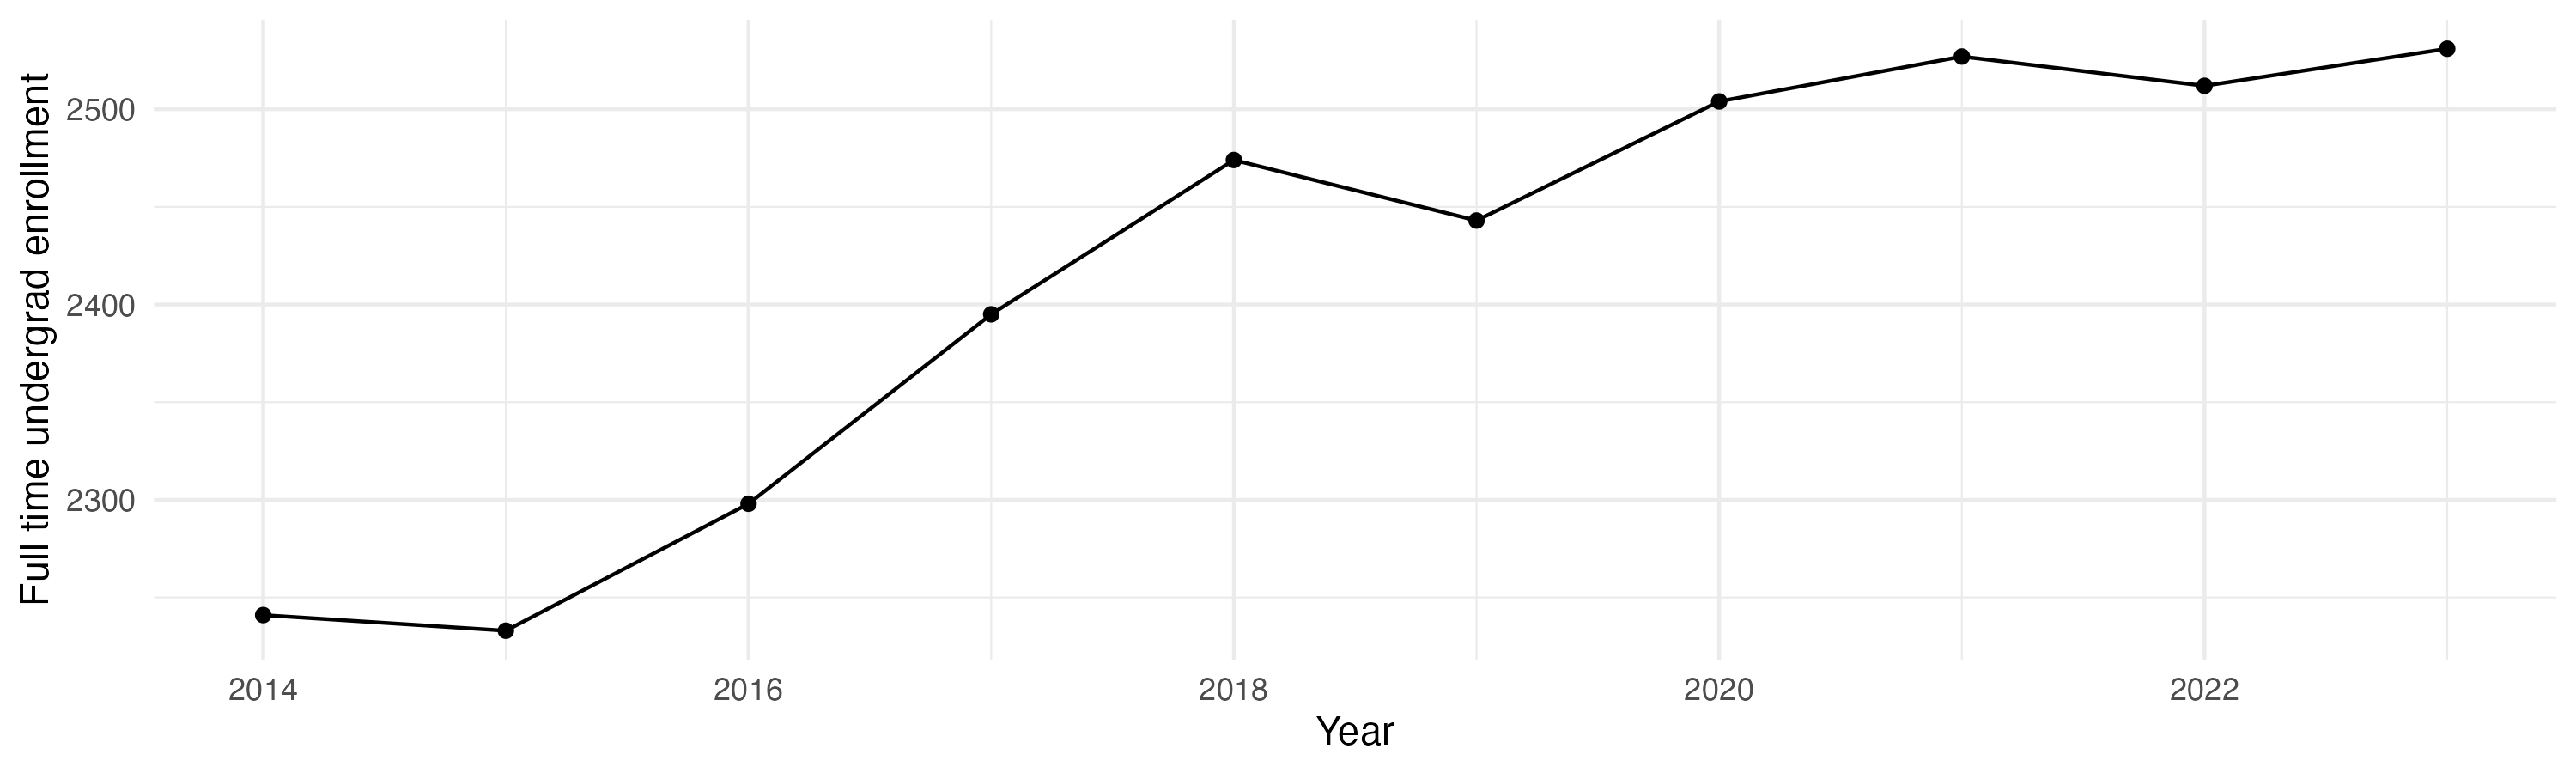
Enrollment
General
Teaching
Tenure track faculty are those who are eligible for tenure. This includes both pre-tenure and tenured faculty. Once faculty get tenure, they are (generally) protected from being fired for intellectual reasons, helping to ensure their freedom in teaching and research. They can still lose their positions for misconduct, financial problems, not fulfilling their duties, or other reasons.
Non-tenure track faculty are not eligible for tenure. Some are hired one semester at a time, some have multi-year contracts. They typically have a higher teaching load than tenure track faculty, leaving less time for research or other creative endeavors. They are also easier to fire than tenured faculty. Sometimes they are external experts (a noted musician, a former senator) who are hired to teach some classes without the expected permanence of a tenure-track position.
Note that this chart uses US federal demographic data: it only has two genders and a specified set of ethnicities and races.
Having a low student to faculty ratio is considered a good thing by many, as it can mean more individual attention.
Geography
This has information on the location of the institution. See the about page for more information on what the metrics are and how they are calculated.
Financial Aid
Graduation
Note these are bachelors graduation rates in six years, not four (this is standard). Sample sizes can be small for some demographic groups with few individuals in a school, leading to large year-to-year fluctuations and often extreme values for those groups (if there are two individuals in the class with a given identity, the possible graduation rates are 0%, 50%, or 100% depending on whether zero, one, or both students graduate within six years).
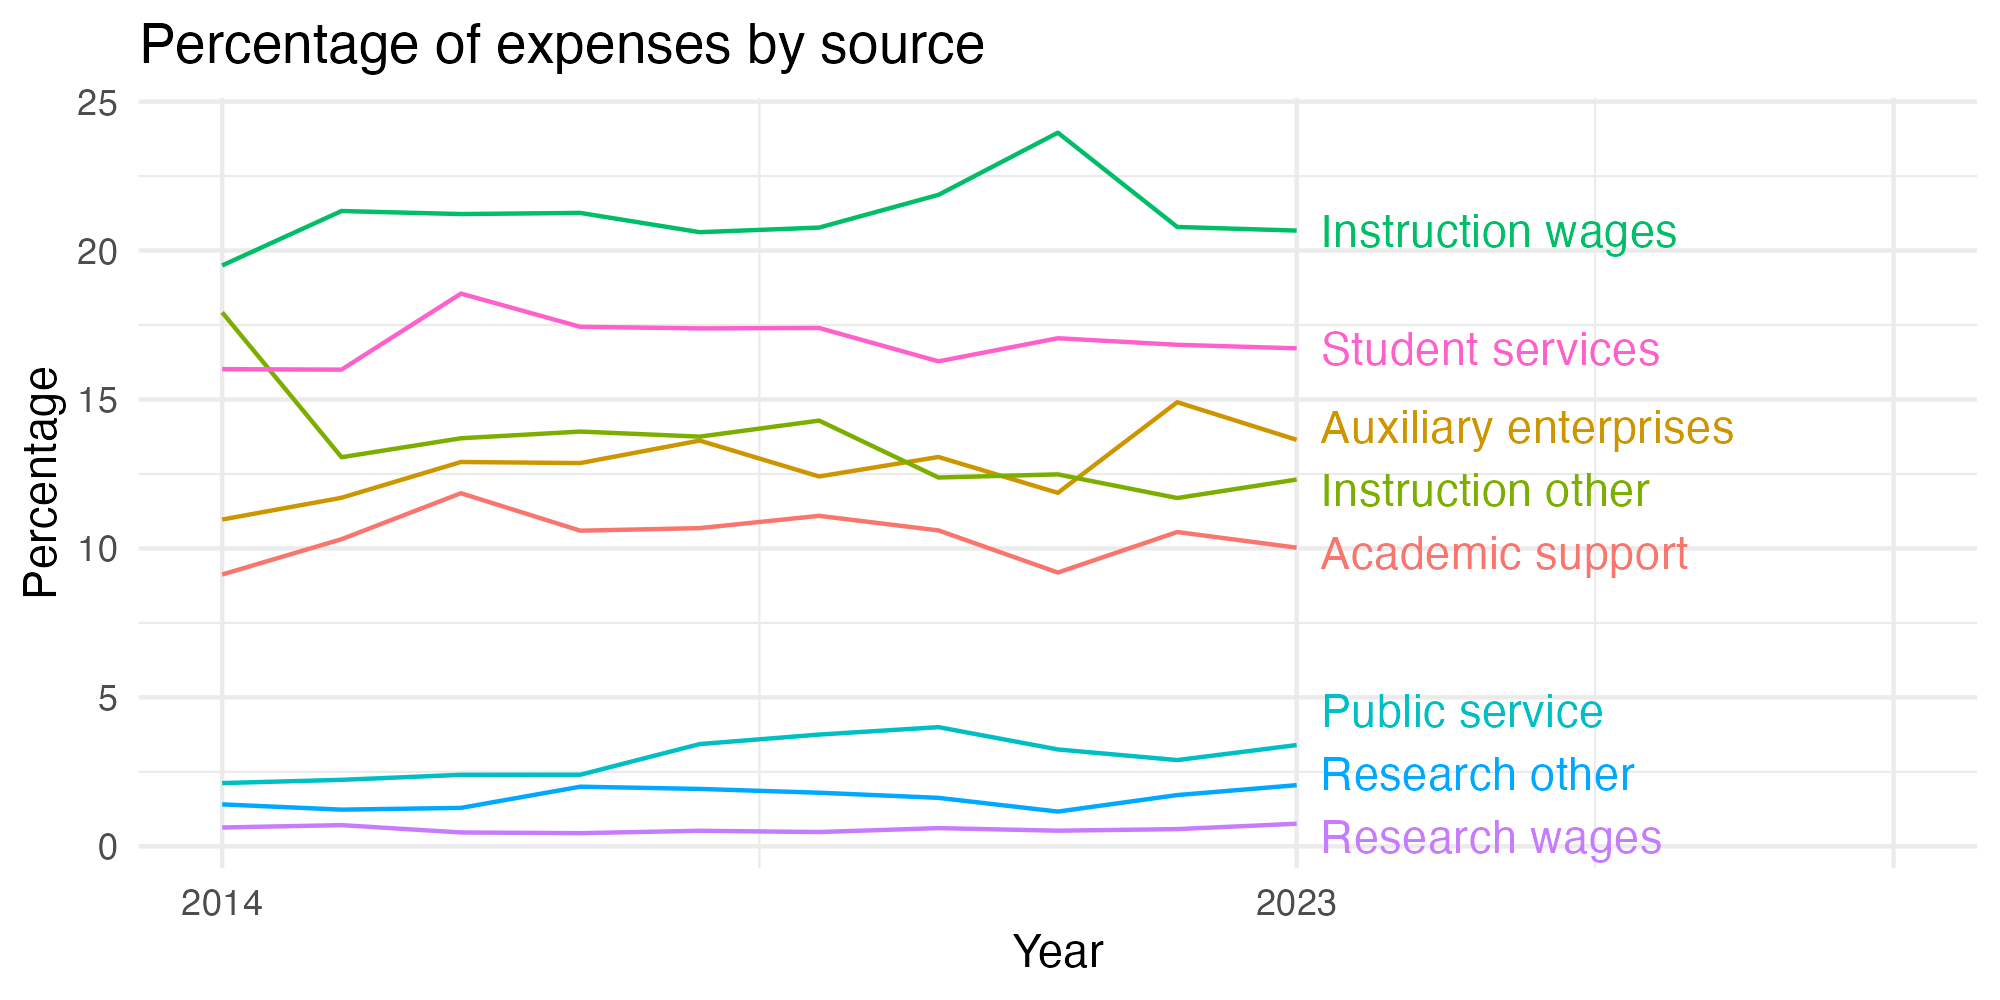
Expense distribution
Colleges have various expenses, and the share of those has changed through time. A recent (July 1, 2026) article suggested that faculty salaries tend to be decreasing as a component of all college expenses. This plot (if data are available) shows wages and salaries used for instruction (which include faculty and others supporting instruction), other instructional costs, and other costs as a percentage of a college’s overall reported expenses each year.
Library
Libraries are changing rapidly. Note that how institutions count digital collections may vary.
Diversity
The US Census Bureau has a diversity index that goes from 0 to 1. In their words, “A 0-value indicates that everyone in the population has the same racial and ethnic characteristics. A value close to 1 indicates that everyone in the population has different racial and ethnic characteristics.” This uses their formula, but with the resolution available for the federal IPEDS data (which does not separate for a given demographic group whether members identify as Hispanic or not). This metric is about heterogeneity within the population, not the proportion of the population that comes from historically excluded groups.
Following the practice of the census, the index is multiplied by 100 to give the percentage probability a random pair of individuals will have a different background. Most institutions argue that diversity is a benefit, so by default a higher number is listed as better, but there may be cases where this measure does not reflect the mission of a college (for example, 70% of the students at a tribal college or university may be American Indian: that could be low-scoring by this metric but should not be read as “bad” given the institution’s mission).
These numbers are based on the most recent year available, generally 2024, which predates effects of the US Supreme Court’s striking down of affirmative action. This has often changed, sometimes dramatically, the incoming student demographics at some institutions.
Overall diversity
Freshman profile
Demographic data for first time degree-seeking students. Note that this uses US federal demographic data: it only has two genders and a specified set of ethnicities and races.
Freshman geography
Test scores
SAT scores
ACT scores
Majors
This presents information on the number of majors and the median earnings one and five years after graduation for people who got a degree from this institution in that field. The earnings are for those who are working and not enrolled in further education. The earnings data (from the federal college scorecard) also has information on earnings for those categorized as ‘MALE’ and ‘NOMALE’ – for readability, these are recategorized here as “Men” and “Women”, respectively, which adopts the gender binary used in other federal data. “W/M earnings ratio” is the median earnings of women divided by men, as a percentage.
Bachelors
Masters
Doctorate
Certificate
Associates
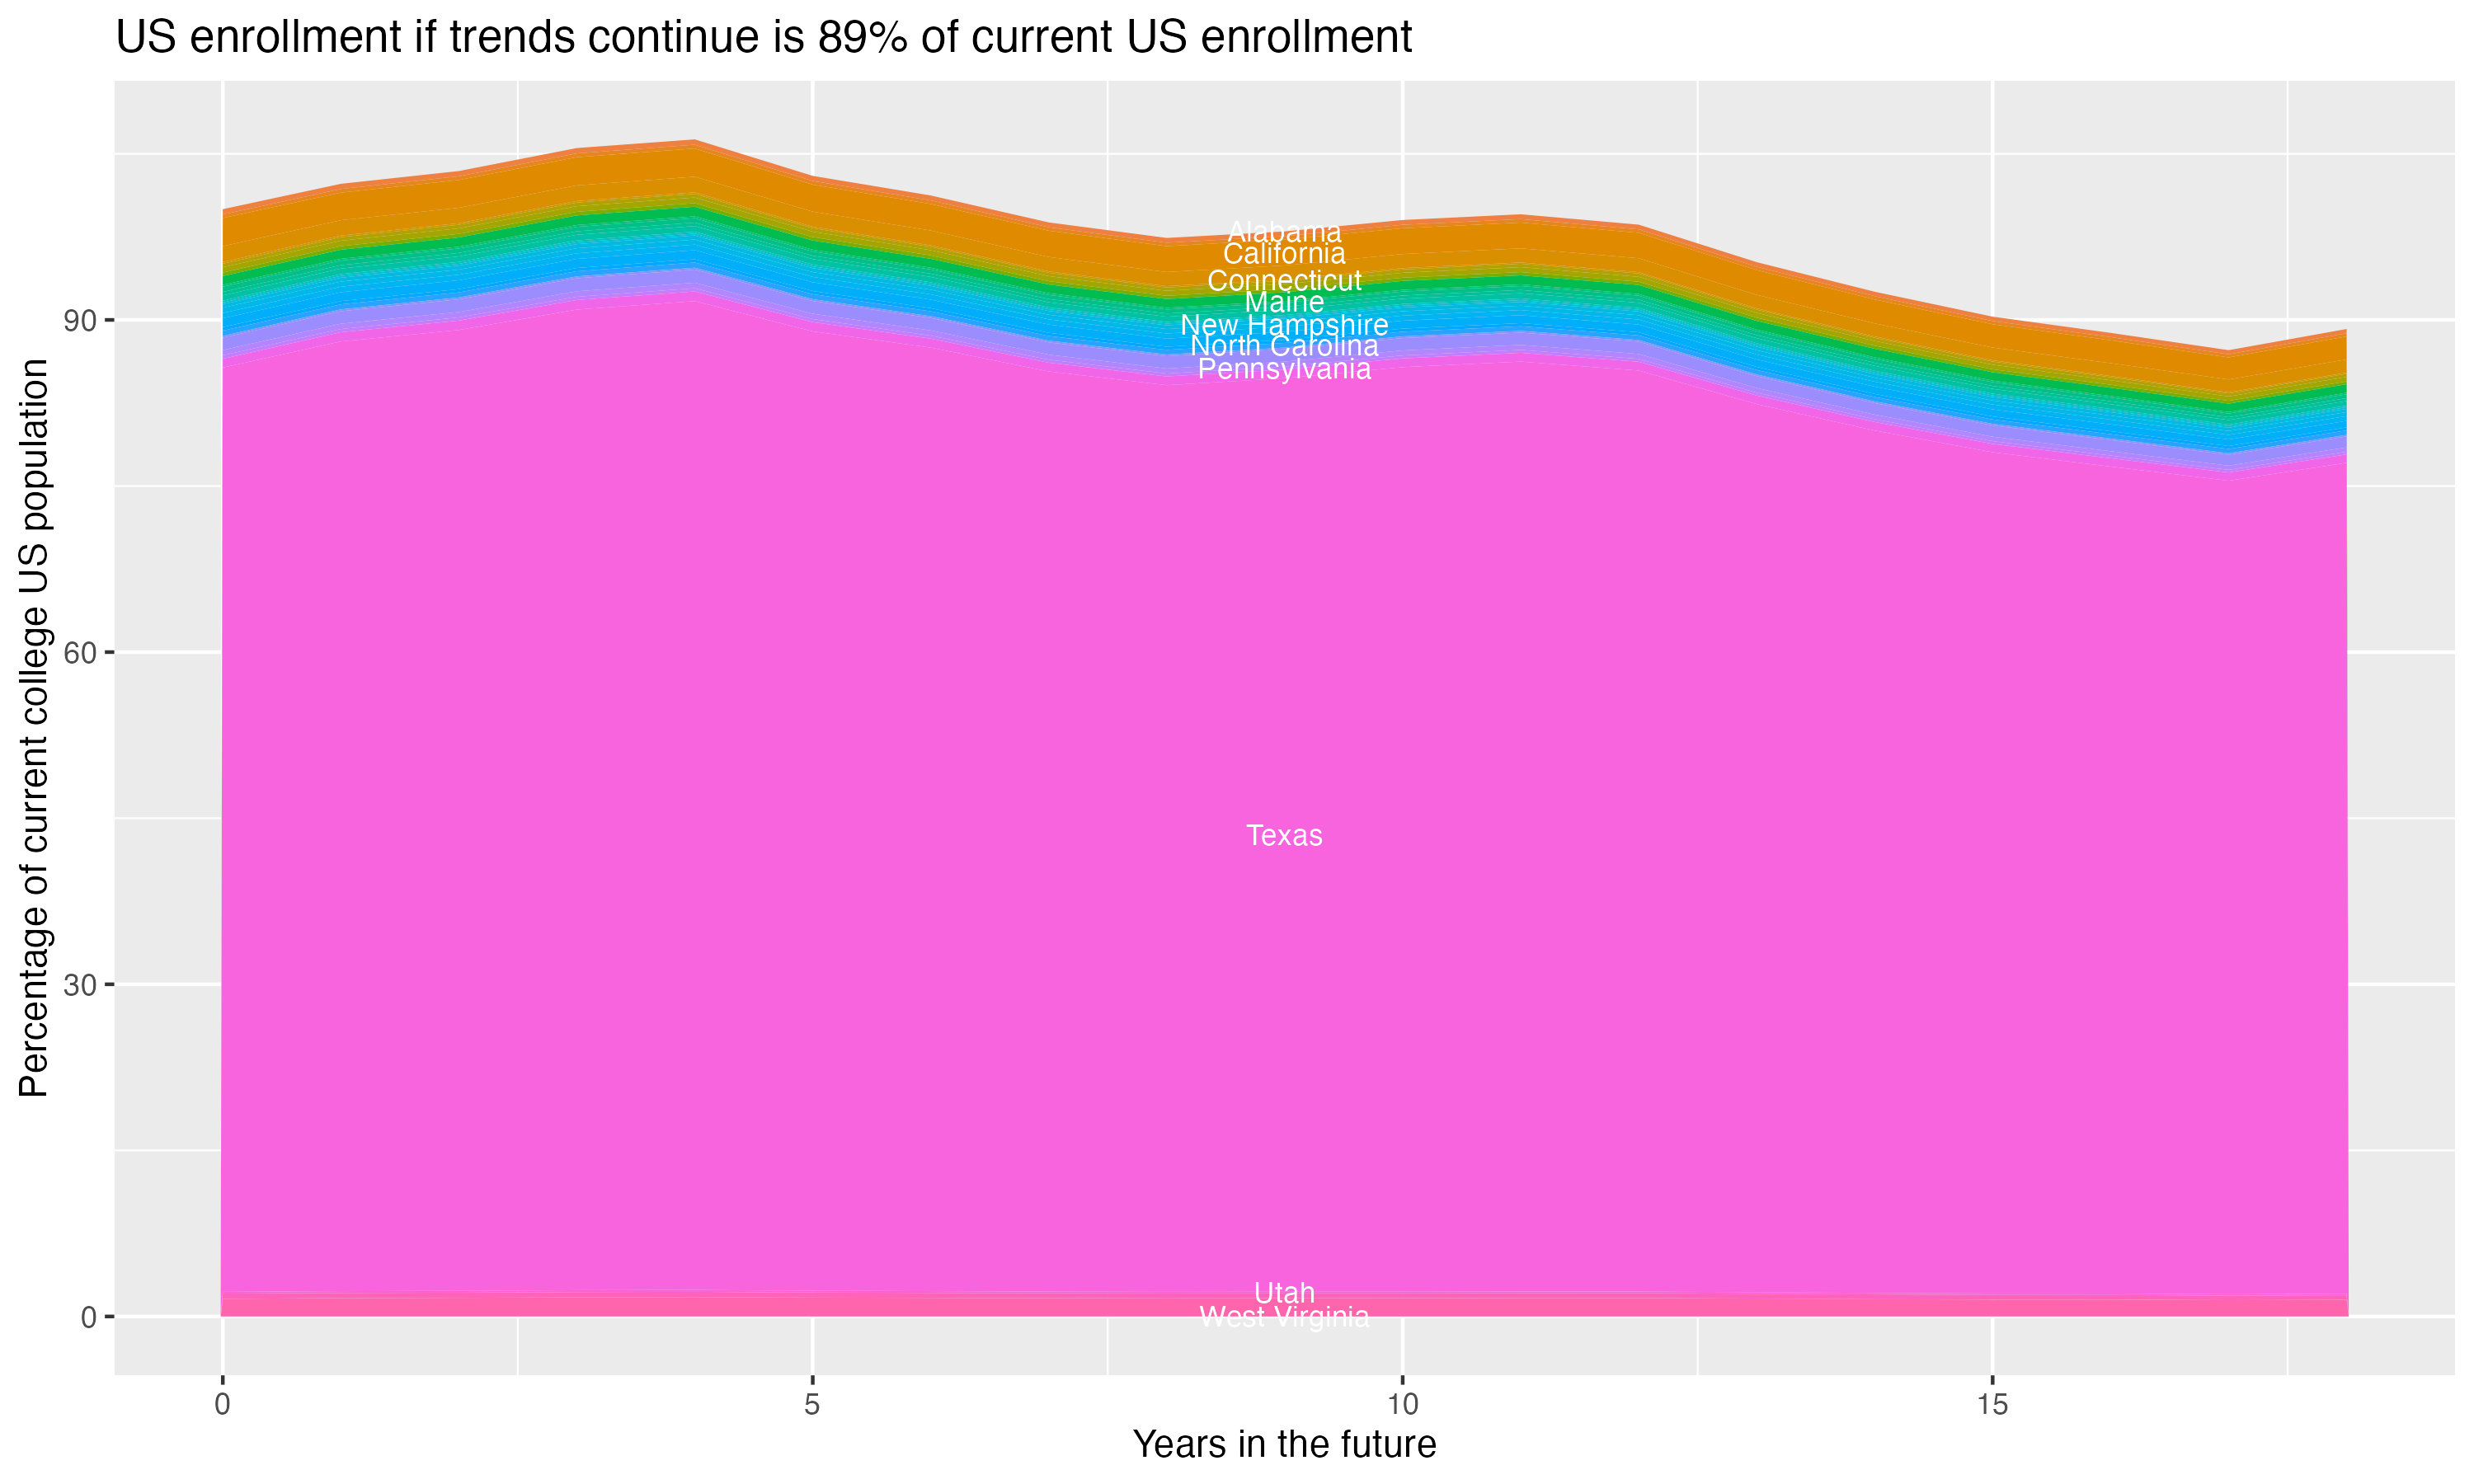
Demographic cliff
There is a concern that giving changing US demographics, the number of students in the age groups who most commonly attend four year colleges will drop off, decreasing overall enrollment. This is often referred to as the “demographic cliff”, and it can be a concern for colleges concerned about the risk of falling enrollment. For this section, the analysis uses US census data on the number of people in each state by age, and the proportion of students that come from each state for this particular college, to crudely model what will happen if everything remains constant except the demographic change in the population of 18 year olds in each year – it does not account for things like the college increasing its admission rate, attracting more students from states without the same demographic changes or from other countries, or changes in the proportion of students who go to college.