Saint Leo University
Saint Leo University is located in Saint Leo, Florida. It is a private not-for-profit, 4-year or above institution.
From Wikipedia: Saint Leo University is a private Catholic university in St. Leo, Florida, United States. It was established in 1889. The university is associated with the Holy Name Monastery, a Benedictine convent, and Saint Leo Abbey, a Benedictine monastery. The university and the abbey are both named for Pope Leo the Great, bishop of Rome from 440 to 461. The name also honors Leo XIII, who was Pope at the time the university was founded, and Leo Haid, then abbot of Maryhelp Abbey in North Carolina, now Belmont Abbey, who participated in founding the university and served as its first president. The first Catholic college in Florida, Saint Leo is one of the fifteen largest Catholic colleges in the United States. It enrolls students at the traditional University Campus, through its Center for Online Learning, and at five regional Education Centers. University-wide, Saint Leo educates students from all 50 states, the District of Columbia, three United States territories, and more than 80 countries. As of 2023, total enrollment was 10,231. Saint Leo was one of the first American universities to provide distance learning opportunities to students, beginning with educating military men and women in 1973 during the Vietnam era at the height of the anti-war movement. Saint Leo University offers more than 55 associate, baccalaureate, and master’s degrees, and certificate programs and inaugurated its first doctoral program in 2013. The university website listed 447 faculty and staff members in July 2025.
Overview of institution
This, and the rest of the page, use info from the most recent year available, generally 2024.
Institution kind: Doctoral/Professional Universities
Undergrad program: Professions plus arts & sciences, some graduate coexistence
Graduate program: Research Doctoral: Single program-Other
Enrollment profile: Majority undergraduate (see more details below)
Average net price for undergrads on financial aid: $19,478 (1.1 times the equivalent cost of Harvard).
Actual price for your family: Go here to see what your family may be asked to pay. It can be MUCH lower than the average price but also higher for some.
Size and setting: Four-year, medium, primarily nonresidential
In state percentage: 65% of first year students come from Florida
In US percentage: 91% of first year students come from the US
This institution has a religious affiliation of Roman Catholic
Graduation rate (within 6 years) for students seeking a Bachelors: 48.8% (this is what is usually reported as “graduation rate”)
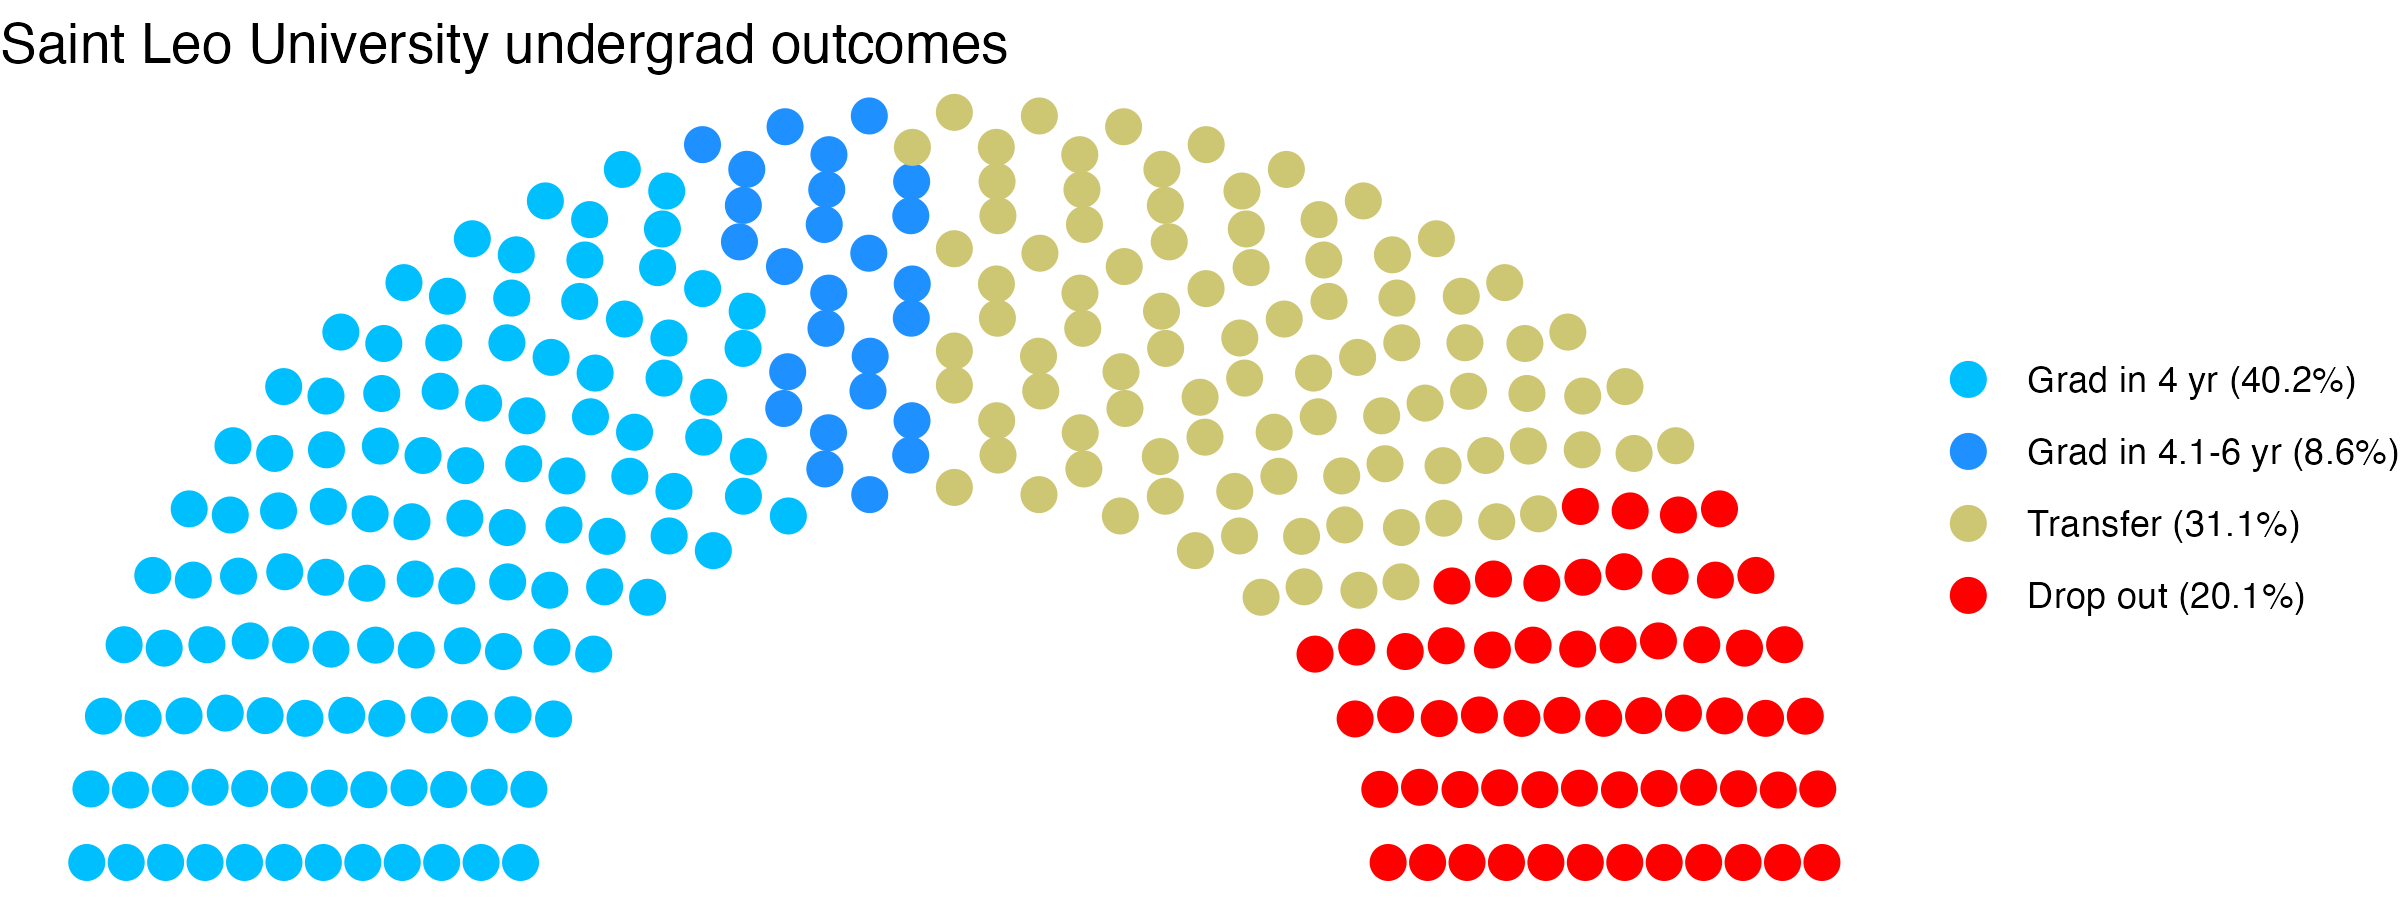
Graduation rate (within 4 years) for students seeking a Bachelors: 40.2%
Percent of students seeking a Bachelors who transfer out of this institution: 31.1%
Student to tenure-stream faculty ratio: 51.5 (undergrads to tenure-stream faculty) [Tenure explained]
Student to faculty ratio: 38.5 (undergrads to all faculty)
Degrees offered: Certificate of less than 1 year, Certificate of less than 12 weeks, Certificate of at least 12 weeks but less than 1 year, Associate’s degree, Bachelor’s degree, Postbaccalaureate certificate, Master’s degree, Doctor’s degree: research scholarship
Schedule: Semester
Institution provides on campus housing: Yes
Dorm capacity: There are enough dorm beds for 1545 students
Freshmen required to live on campus: No
Advanced placement (AP) credits used: Yes
Disabilities: 3.36 percent of undergrads are registered as having disabilities.
Undergrad outcomes
This plot shows the outcomes for first time, full time undergraduates seeking Bachelor’s degrees (if the data are available).
Map
Comparisons
The sections below show this institution compared with others. The ones listed are ones it has identified as peers, who consider themselves peers, and/or who the federal government considers peers. If a comparison school has the same value as the focal school, its cell is grayed out. In fields where there is a common view that higher (or lower) values are better, the best values are in blue, the worst values are in red. If there isn’t a sense of a particular value being better, values are shown in varying shades of green. Arrows show where there is a signficant trend over time for a school. You can swipe across the table to see more of it; the focal school column is always visible.
- Saint Leo University compares itself to these institutions, but not vice versa: The University of Tampa, Union University, LeTourneau University, Lipscomb University, Campbellsville University, University of the Cumberlands, Queens University of Charlotte, Saint Edward’s University, Texas Wesleyan University, Christian Brothers University, Tusculum University, Southern Wesleyan University, Cumberland University, Mary Baldwin University, Piedmont University, Pfeiffer University
- These institutions compare themselves to Saint Leo University, but not vice versa: Embry-Riddle Aeronautical University-Daytona Beach, Columbia College, Regent University, Lee University, Mount Marty University, Troy University, Rasmussen University-Florida, Walsh University, University of Mary, Southeastern University, Ave Maria University, Campbell University, St. Mary’s University, Barry University, DeVry University-Florida, Warner University, Indiana Wesleyan University-National & Global, Upper Iowa University, Lynn University, South University-Savannah, South University-Tampa, St. Thomas University, Palm Beach Atlantic University, University of Holy Cross
Enrollment
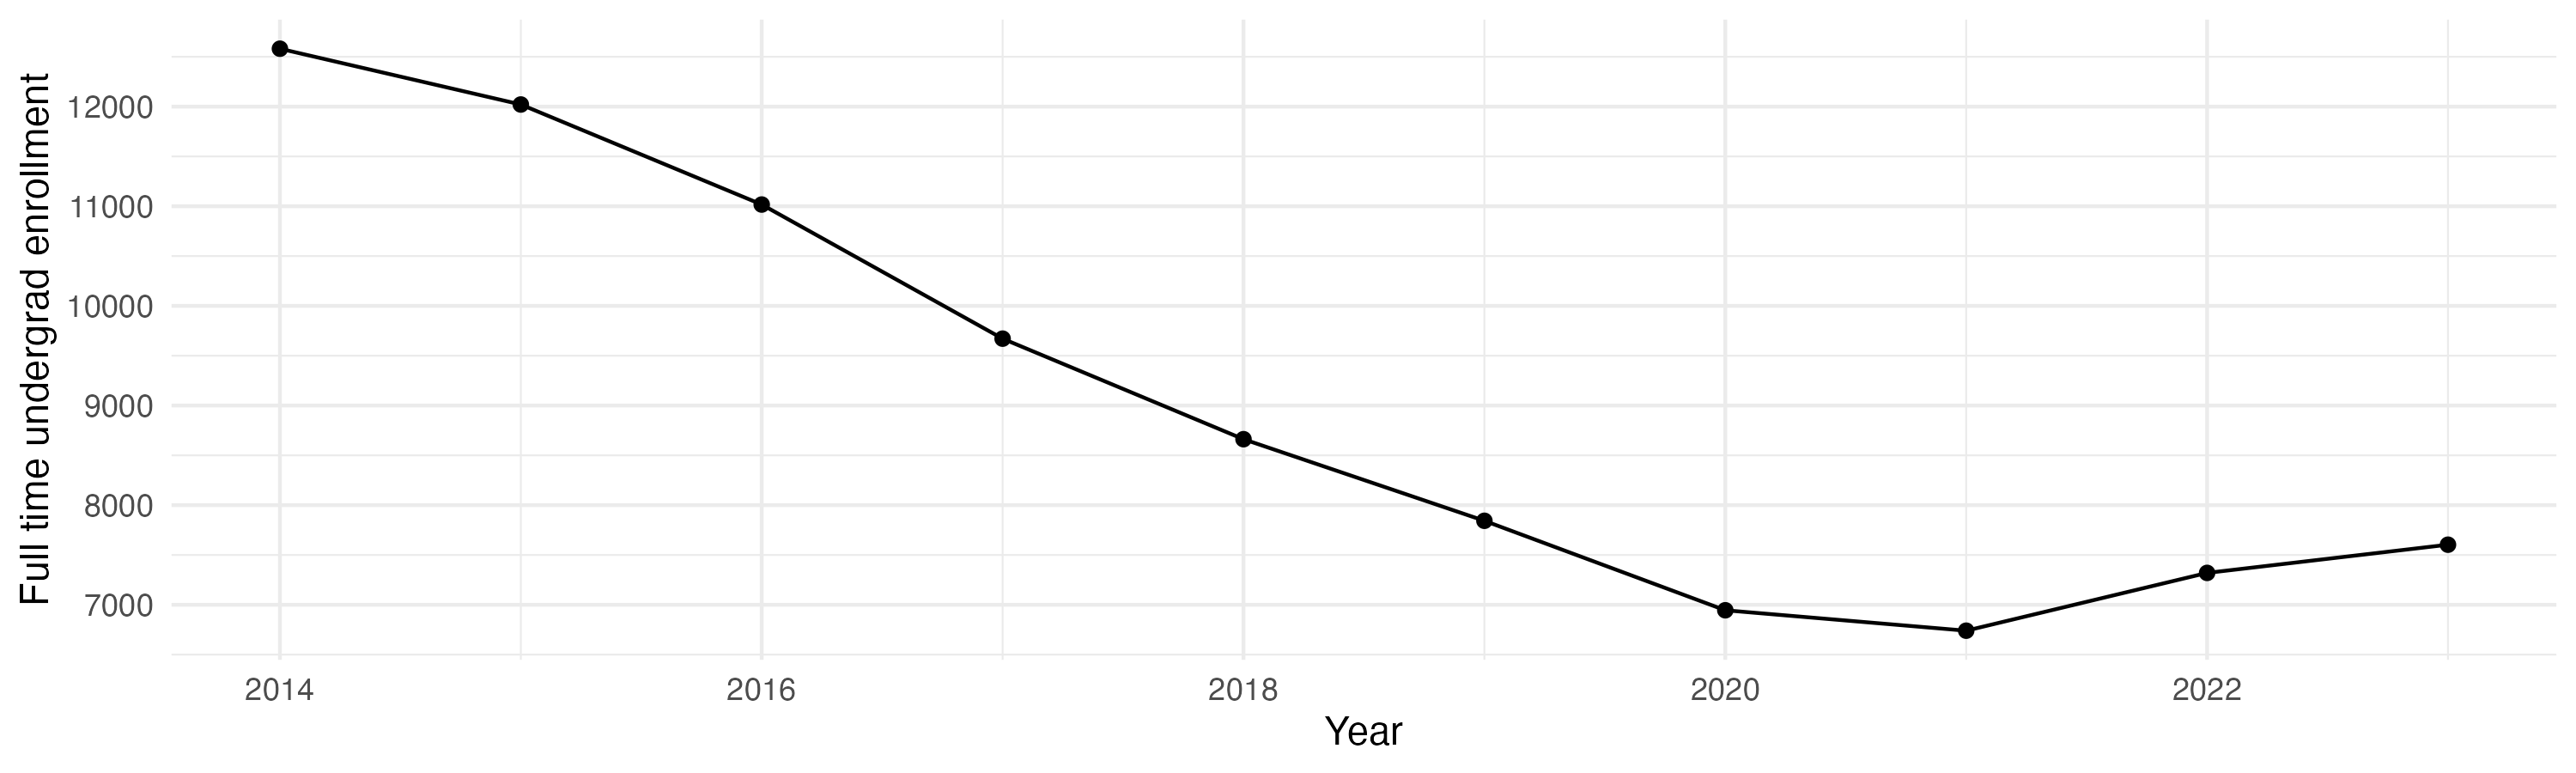
General
Teaching
Tenure track faculty are those who are eligible for tenure. This includes both pre-tenure and tenured faculty. Once faculty get tenure, they are (generally) protected from being fired for intellectual reasons, helping to ensure their freedom in teaching and research. They can still lose their positions for misconduct, financial problems, not fulfilling their duties, or other reasons.
Non-tenure track faculty are not eligible for tenure. Some are hired one semester at a time, some have multi-year contracts. They typically have a higher teaching load than tenure track faculty, leaving less time for research or other creative endeavors. They are also easier to fire than tenured faculty. Sometimes they are external experts (a noted musician, a former senator) who are hired to teach some classes without the expected permanence of a tenure-track position.
Note that this chart uses US federal demographic data: it only has two genders and a specified set of ethnicities and races.
Having a low student to faculty ratio is considered a good thing by many, as it can mean more individual attention.
Geography
This has information on the location of the institution. See the about page for more information on what the metrics are and how they are calculated.
Financial Aid
Graduation
Note these are bachelors graduation rates in six years, not four (this is standard). Sample sizes can be small for some demographic groups with few individuals in a school, leading to large year-to-year fluctuations and often extreme values for those groups (if there are two individuals in the class with a given identity, the possible graduation rates are 0%, 50%, or 100% depending on whether zero, one, or both students graduate within six years).
Library
Libraries are changing rapidly. Note that how institutions count digital collections may vary.
Diversity
The US Census Bureau has a diversity index that goes from 0 to 1. In their words, “A 0-value indicates that everyone in the population has the same racial and ethnic characteristics. A value close to 1 indicates that everyone in the population has different racial and ethnic characteristics.” This uses their formula, but with the resolution available for the federal IPEDS data (which does not separate for a given demographic group whether members identify as Hispanic or not). This metric is about heterogeneity within the population, not the proportion of the population that comes from historically excluded groups.
Following the practice of the census, the index is multiplied by 100 to give the percentage probability a random pair of individuals will have a different background. Most institutions argue that diversity is a benefit, so by default a higher number is listed as better, but there may be cases where this measure does not reflect the mission of a college (for example, 70% of the students at a tribal college or university may be American Indian: that could be low-scoring by this metric but should not be read as “bad” given the institution’s mission).
These numbers are based on the most recent year available, generally 2024, which predates effects of the US Supreme Court’s striking down of affirmative action. This has often changed, sometimes dramatically, the incoming student demographics at some institutions.
Overall diversity
Freshman profile
Demographic data for first time degree-seeking students. Note that this uses US federal demographic data: it only has two genders and a specified set of ethnicities and races.
Freshman geography
Test scores
SAT scores
ACT scores
Majors
This presents information on the number of majors and the median earnings one and five years after graduation for people who got a degree from this institution in that field. The earnings are for those who are working and not enrolled in further education. The earnings data (from the federal college scorecard) also has information on earnings for those categorized as ‘MALE’ and ‘NOMALE’ – for readability, these are recategorized here as “Men” and “Women”, respectively, which adopts the gender binary used in other federal data. “W/M earnings ratio” is the median earnings of women divided by men, as a percentage.
Bachelors
Masters
Doctorate
Certificate
Associates
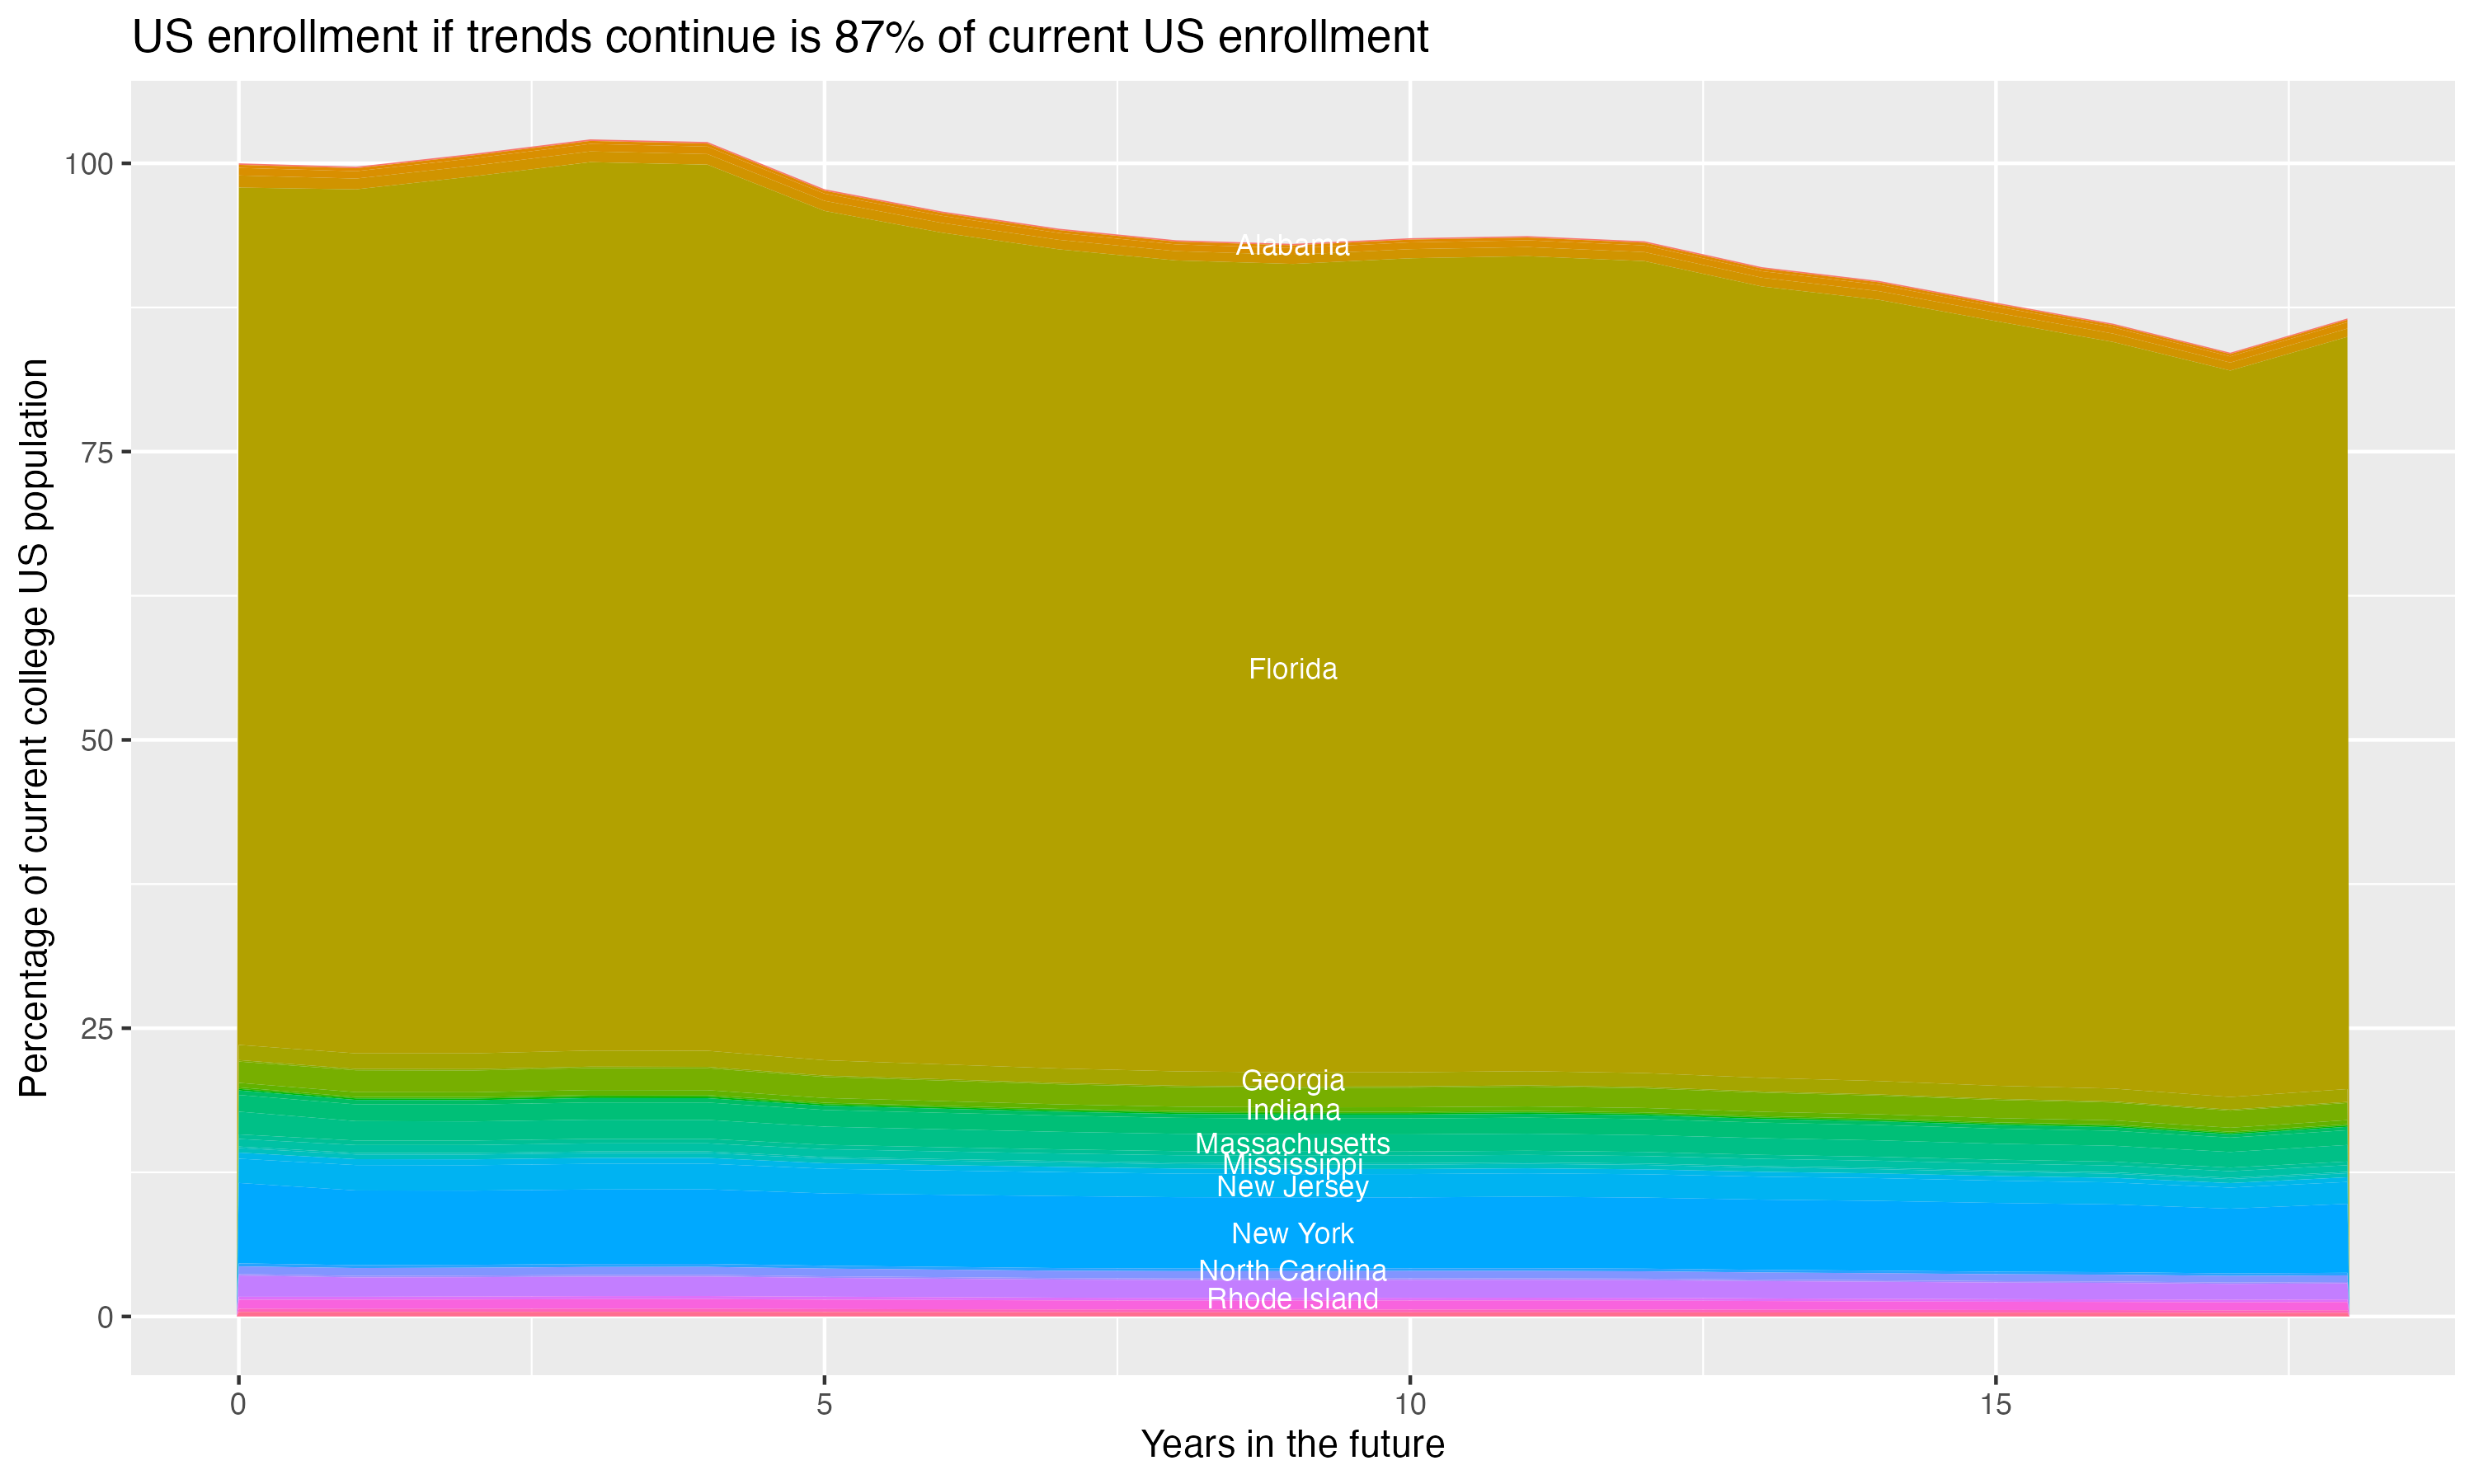
Demographic cliff
There is a concern that giving changing US demographics, the number of students in the age groups who most commonly attend four year colleges will drop off, decreasing overall enrollment. This is often referred to as the “demographic cliff”, and it can be a concern for colleges concerned about the risk of falling enrollment. For this section, the analysis uses US census data on the number of people in each state by age, and the proportion of students that come from each state for this particular college, to crudely model what will happen if everything remains constant except the demographic change in the population of 18 year olds in each year – it does not account for things like the college increasing its admission rate, attracting more students from states without the same demographic changes or from other countries, or changes in the proportion of students who go to college.