The University of Tampa
The University of Tampa is located in Tampa, Florida. It is a private not-for-profit, 4-year or above institution.
From Wikipedia: The University of Tampa (UTampa, UT or Tampa U) is a private university in Tampa, Florida, United States. It is accredited by the Southern Association of Colleges and Schools. UTampa offers more than 200 programs of study, including 19 master’s degrees and a broad variety of majors, minors, pre-professional programs and certificates. The school was initially established in 1931 as a junior college housed in a local high school. In 1933, it became a four-year university and moved onto the grounds of the recently closed Tampa Bay Hotel. The large and lavish central building of Henry B. Plant’s resort was converted into Plant Hall, and the Moorish minarets atop the distinctive structure have long been a symbol of both the school and of the city of Tampa in general. UTampa grew gradually in the 20th century while navigating several periods of financial difficulty, including in the 1970s, when the school decided to fold its locally popular football program due to concerns about costs. Successful fundraising and marketing beginning in the 1990s helped put the school on more stable footing. Since then, it has extensively expanded and modernized its campus while increasing enrollment to over 11,000 students.
Overview of institution
This, and the rest of the page, use info from the most recent year available, generally 2024.
Institution kind: Master’s Colleges & Universities: Larger Programs
Undergrad program: Balanced arts & sciences/professions, some graduate coexistence
Graduate program: Postbaccalaureate: Comprehensive programs
Enrollment profile: Very high undergraduate (see more details below)
Average net price for undergrads on financial aid: $35,975 (2 times the equivalent cost of Harvard).
Actual price for your family: Go here to see what your family may be asked to pay. It can be MUCH lower than the average price but also higher for some.
Size and setting: Four-year, medium, primarily residential
In state percentage: 18% of first year students come from Florida
In US percentage: 93% of first year students come from the US
Graduation rate (within 6 years) for students seeking a Bachelors: 61.9% (this is what is usually reported as “graduation rate”)
Graduation rate (within 4 years) for students seeking a Bachelors: 52.2%
Student to tenure-stream faculty ratio: 33.1 (undergrads to tenure-stream faculty) [Tenure explained]
Student to faculty ratio: 21.0 (undergrads to all faculty)
Degrees offered: Bachelor’s degree, Postbaccalaureate certificate, Master’s degree, Post master’s certificate, Doctor’s degree: professional practice
Schedule: Semester
Institution provides on campus housing: Yes
Dorm capacity: There are enough dorm beds for 4655 students
Freshmen required to live on campus: No
Advanced placement (AP) credits used: Yes
Disabilities: 16.37 percent of undergrads are registered as having disabilities.
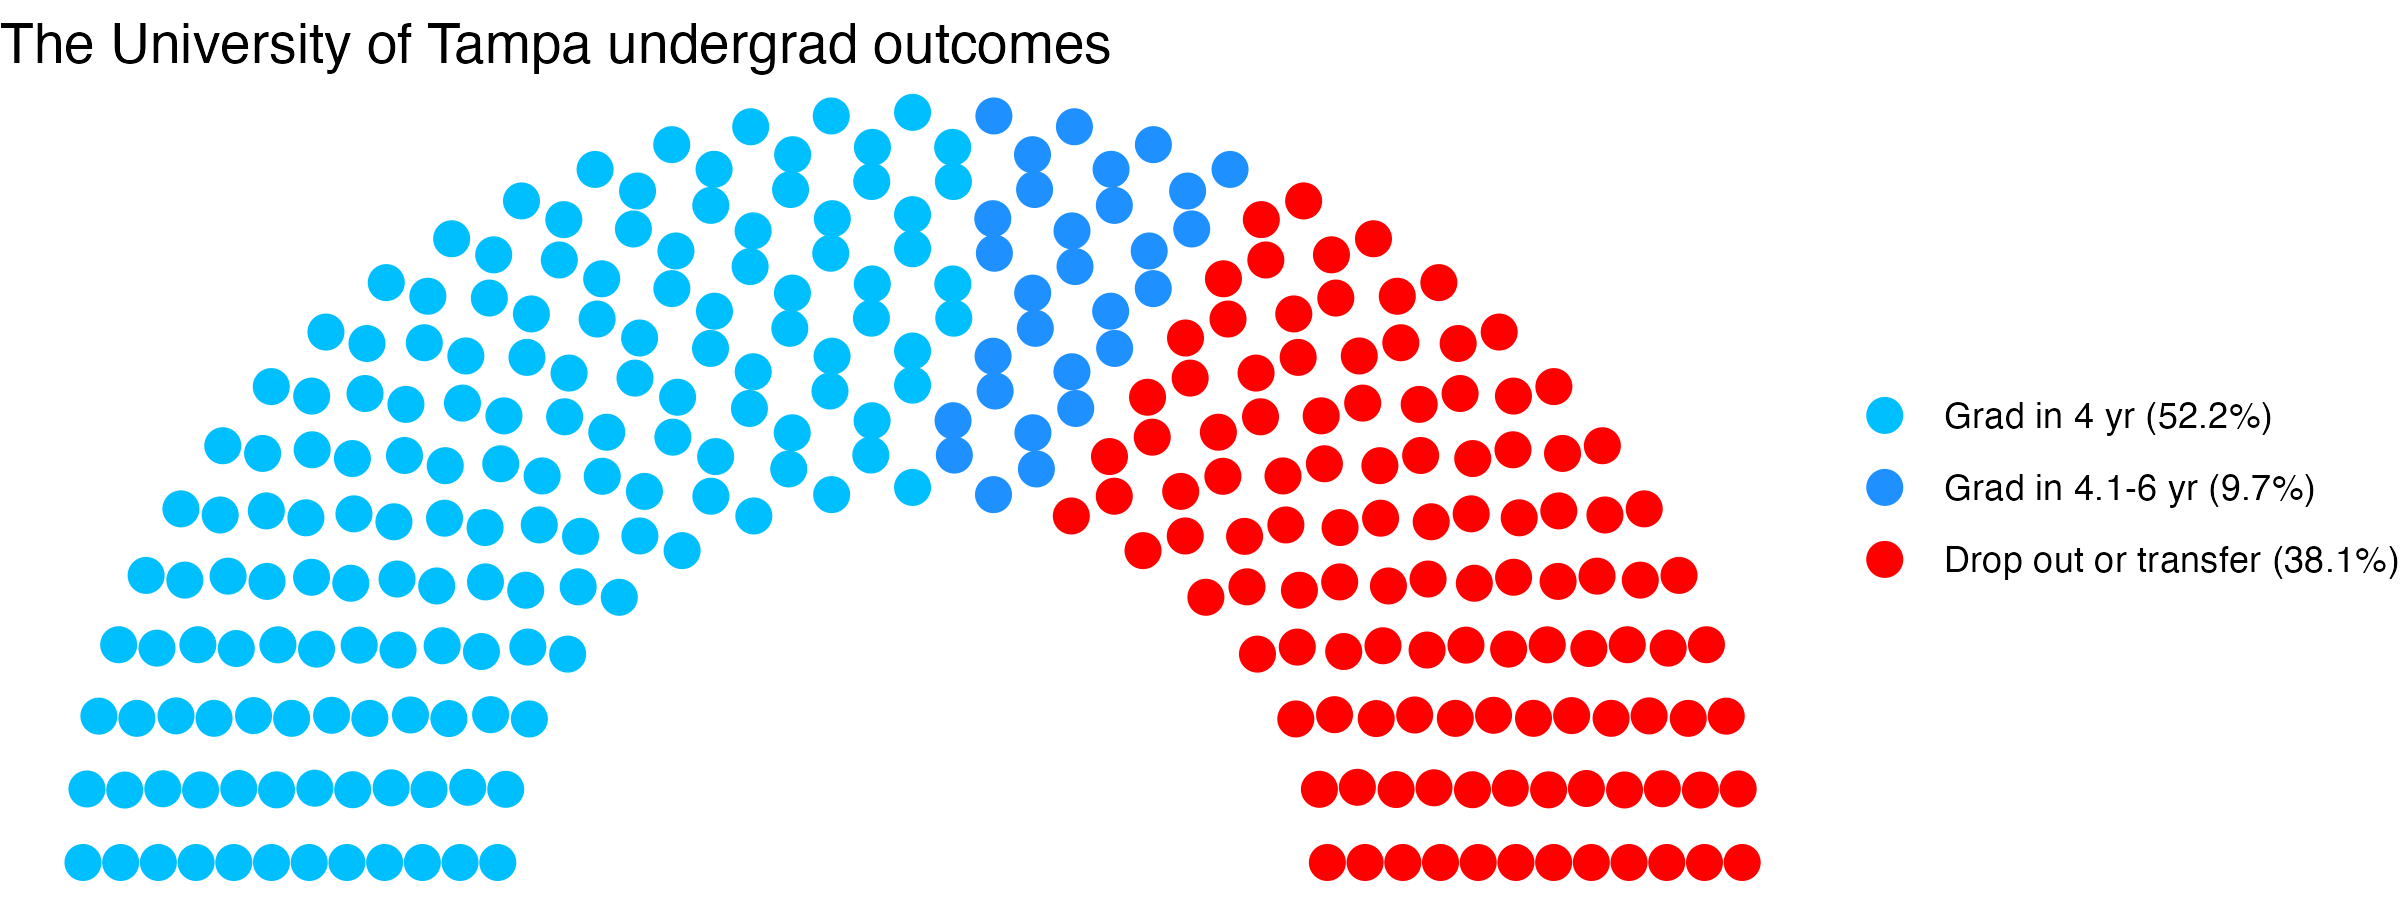
Undergrad outcomes
This plot shows the outcomes for first time, full time undergraduates seeking Bachelor’s degrees (if the data are available).
Map
Comparisons
The sections below show this institution compared with others. The ones listed are ones it has identified as peers, who consider themselves peers, and/or who the federal government considers peers. If a comparison school has the same value as the focal school, its cell is grayed out. In fields where there is a common view that higher (or lower) values are better, the best values are in blue, the worst values are in red. If there isn’t a sense of a particular value being better, values are shown in varying shades of green. Arrows show where there is a signficant trend over time for a school. You can swipe across the table to see more of it; the focal school column is always visible.
- The University of Tampa lists these schools as ones to compare itself within federal IPEDS data, and they do the same back: College of Charleston, Christopher Newport University, Queens University of Charlotte, Spring Hill College, Stetson University, Harding University
- The University of Tampa compares itself to these institutions, but not vice versa: University of Miami, California Polytechnic State University-San Luis Obispo, Villanova University, Syracuse University, Santa Clara University, Trinity University, Loyola Marymount University, American University, CUNY Bernard M Baruch College, Fairfield University, Providence College, Bentley University, University of San Diego, Chapman University, The College of New Jersey, University of Wisconsin-La Crosse, James Madison University, Emerson College, Pepperdine University, University of Dayton, Rollins College, Rochester Institute of Technology, Clark University, University of North Carolina Wilmington, Elon University, Union University, Embry-Riddle Aeronautical University-Daytona Beach, Creighton University, Gonzaga University, Pratt Institute-Main, Appalachian State University, Marist University, DePaul University, University of Denver, Drexel University, Sacred Heart University, Samford University, Rowan University, Loyola University Chicago, Saint Louis University, Mercer University, Northeastern University Oakland, Gallaudet University, Drake University, University of St Thomas, Lipscomb University, Ithaca College, St. John’s University-New York, Bryant University, New Mexico Institute of Mining and Technology, Marquette University, North Central College, University of Northern Iowa, Loyola University Maryland, SUNY College at Geneseo, Seattle University, Quinnipiac University, Duquesne University, Saint Joseph’s University - Philadelphia, University of Dallas, Point Loma Nazarene University, Rockhurst University, Baldwin Wallace University, University of Scranton, Drury University, Butler University, Bradley University, Belmont University, Truman State University, Webster University, Abilene Christian University, Winthrop University, Murray State University, Clarkson University, John Carroll University, Bethel University, Simmons University, Pacific Lutheran University, Le Moyne College, University of Mary Washington, University of Redlands, University of Detroit Mercy, Xavier University, Rutgers University-Camden, Elmhurst University, Manhattan University, Citadel Military College of South Carolina, Otterbein University, Monmouth University, University of Evansville, University of Portland, Canisius University, California Lutheran University, Mount Saint Mary’s University, Loyola University New Orleans, Saint Edward’s University, Kettering University, Bellarmine University, Saint Mary’s College of California, Dominican University, George Fox University, Whitworth University, St Catherine University, University of Illinois Springfield, Valparaiso University, Pacific University, Seattle Pacific University, Milwaukee School of Engineering, St. Mary’s University, Converse University, Christian Brothers University, Hamline University, Westminster University
- These institutions compare themselves to The University of Tampa, but not vice versa: University of Rhode Island, Florida Southern College, Lewis University, University of Hartford, Norwich University, Longwood University, Eastern Washington University, Saint Leo University, Radford University, Southeastern University, The College of Saint Rose, Florida Gulf Coast University, Barry University, Marymount Manhattan College, Lynn University, South University-Tampa, Palm Beach Atlantic University
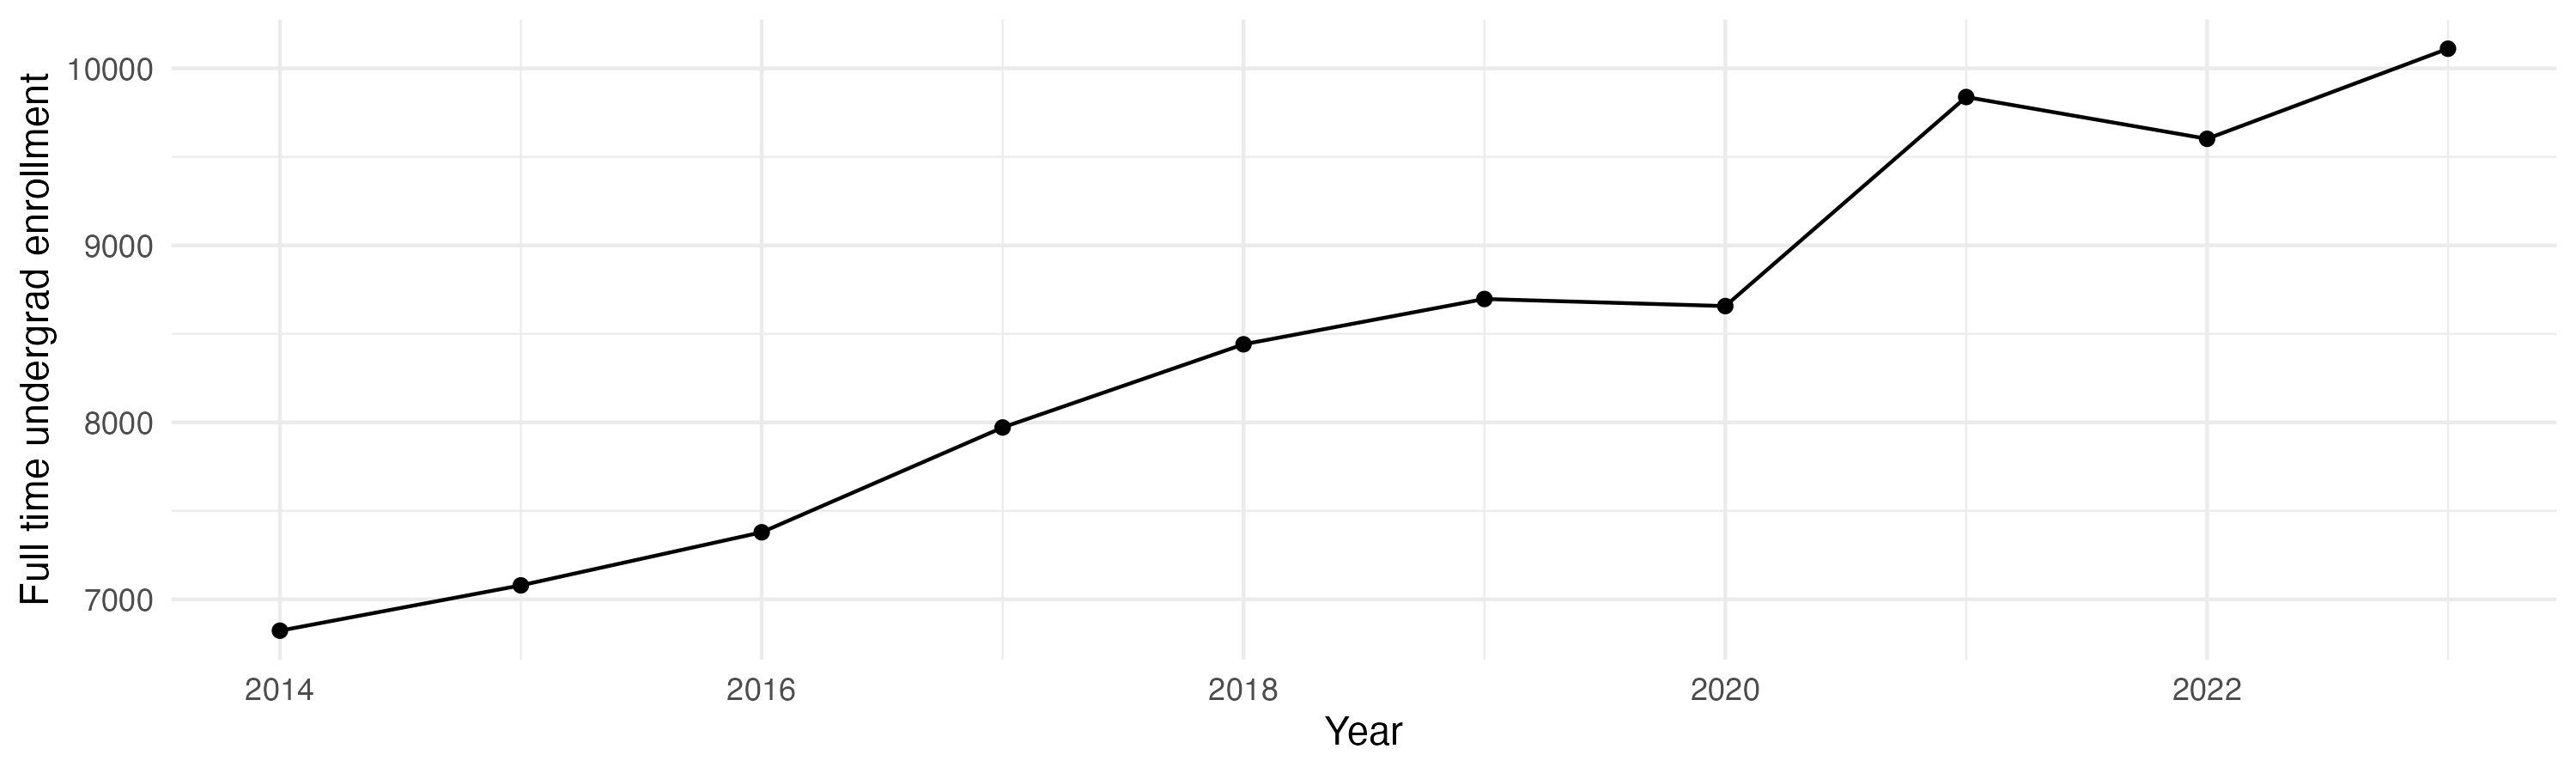
Enrollment
General
Teaching
Tenure track faculty are those who are eligible for tenure. This includes both pre-tenure and tenured faculty. Once faculty get tenure, they are (generally) protected from being fired for intellectual reasons, helping to ensure their freedom in teaching and research. They can still lose their positions for misconduct, financial problems, not fulfilling their duties, or other reasons.
Non-tenure track faculty are not eligible for tenure. Some are hired one semester at a time, some have multi-year contracts. They typically have a higher teaching load than tenure track faculty, leaving less time for research or other creative endeavors. They are also easier to fire than tenured faculty. Sometimes they are external experts (a noted musician, a former senator) who are hired to teach some classes without the expected permanence of a tenure-track position.
Note that this chart uses US federal demographic data: it only has two genders and a specified set of ethnicities and races.
Having a low student to faculty ratio is considered a good thing by many, as it can mean more individual attention.
Geography
This has information on the location of the institution. See the about page for more information on what the metrics are and how they are calculated.
Financial Aid
Graduation
Note these are bachelors graduation rates in six years, not four (this is standard). Sample sizes can be small for some demographic groups with few individuals in a school, leading to large year-to-year fluctuations and often extreme values for those groups (if there are two individuals in the class with a given identity, the possible graduation rates are 0%, 50%, or 100% depending on whether zero, one, or both students graduate within six years).
Library
Libraries are changing rapidly. Note that how institutions count digital collections may vary.
Diversity
The US Census Bureau has a diversity index that goes from 0 to 1. In their words, “A 0-value indicates that everyone in the population has the same racial and ethnic characteristics. A value close to 1 indicates that everyone in the population has different racial and ethnic characteristics.” This uses their formula, but with the resolution available for the federal IPEDS data (which does not separate for a given demographic group whether members identify as Hispanic or not). This metric is about heterogeneity within the population, not the proportion of the population that comes from historically excluded groups.
Following the practice of the census, the index is multiplied by 100 to give the percentage probability a random pair of individuals will have a different background. Most institutions argue that diversity is a benefit, so by default a higher number is listed as better, but there may be cases where this measure does not reflect the mission of a college (for example, 70% of the students at a tribal college or university may be American Indian: that could be low-scoring by this metric but should not be read as “bad” given the institution’s mission).
These numbers are based on the most recent year available, generally 2024, which predates effects of the US Supreme Court’s striking down of affirmative action. This has often changed, sometimes dramatically, the incoming student demographics at some institutions.
Overall diversity
Freshman profile
Demographic data for first time degree-seeking students. Note that this uses US federal demographic data: it only has two genders and a specified set of ethnicities and races.
Freshman geography
Test scores
SAT scores
ACT scores
Majors
This presents information on the number of majors and the median earnings one and five years after graduation for people who got a degree from this institution in that field. The earnings are for those who are working and not enrolled in further education. The earnings data (from the federal college scorecard) also has information on earnings for those categorized as ‘MALE’ and ‘NOMALE’ – for readability, these are recategorized here as “Men” and “Women”, respectively, which adopts the gender binary used in other federal data. “W/M earnings ratio” is the median earnings of women divided by men, as a percentage.
Bachelors
Masters
Doctorate
Certificate
Associates
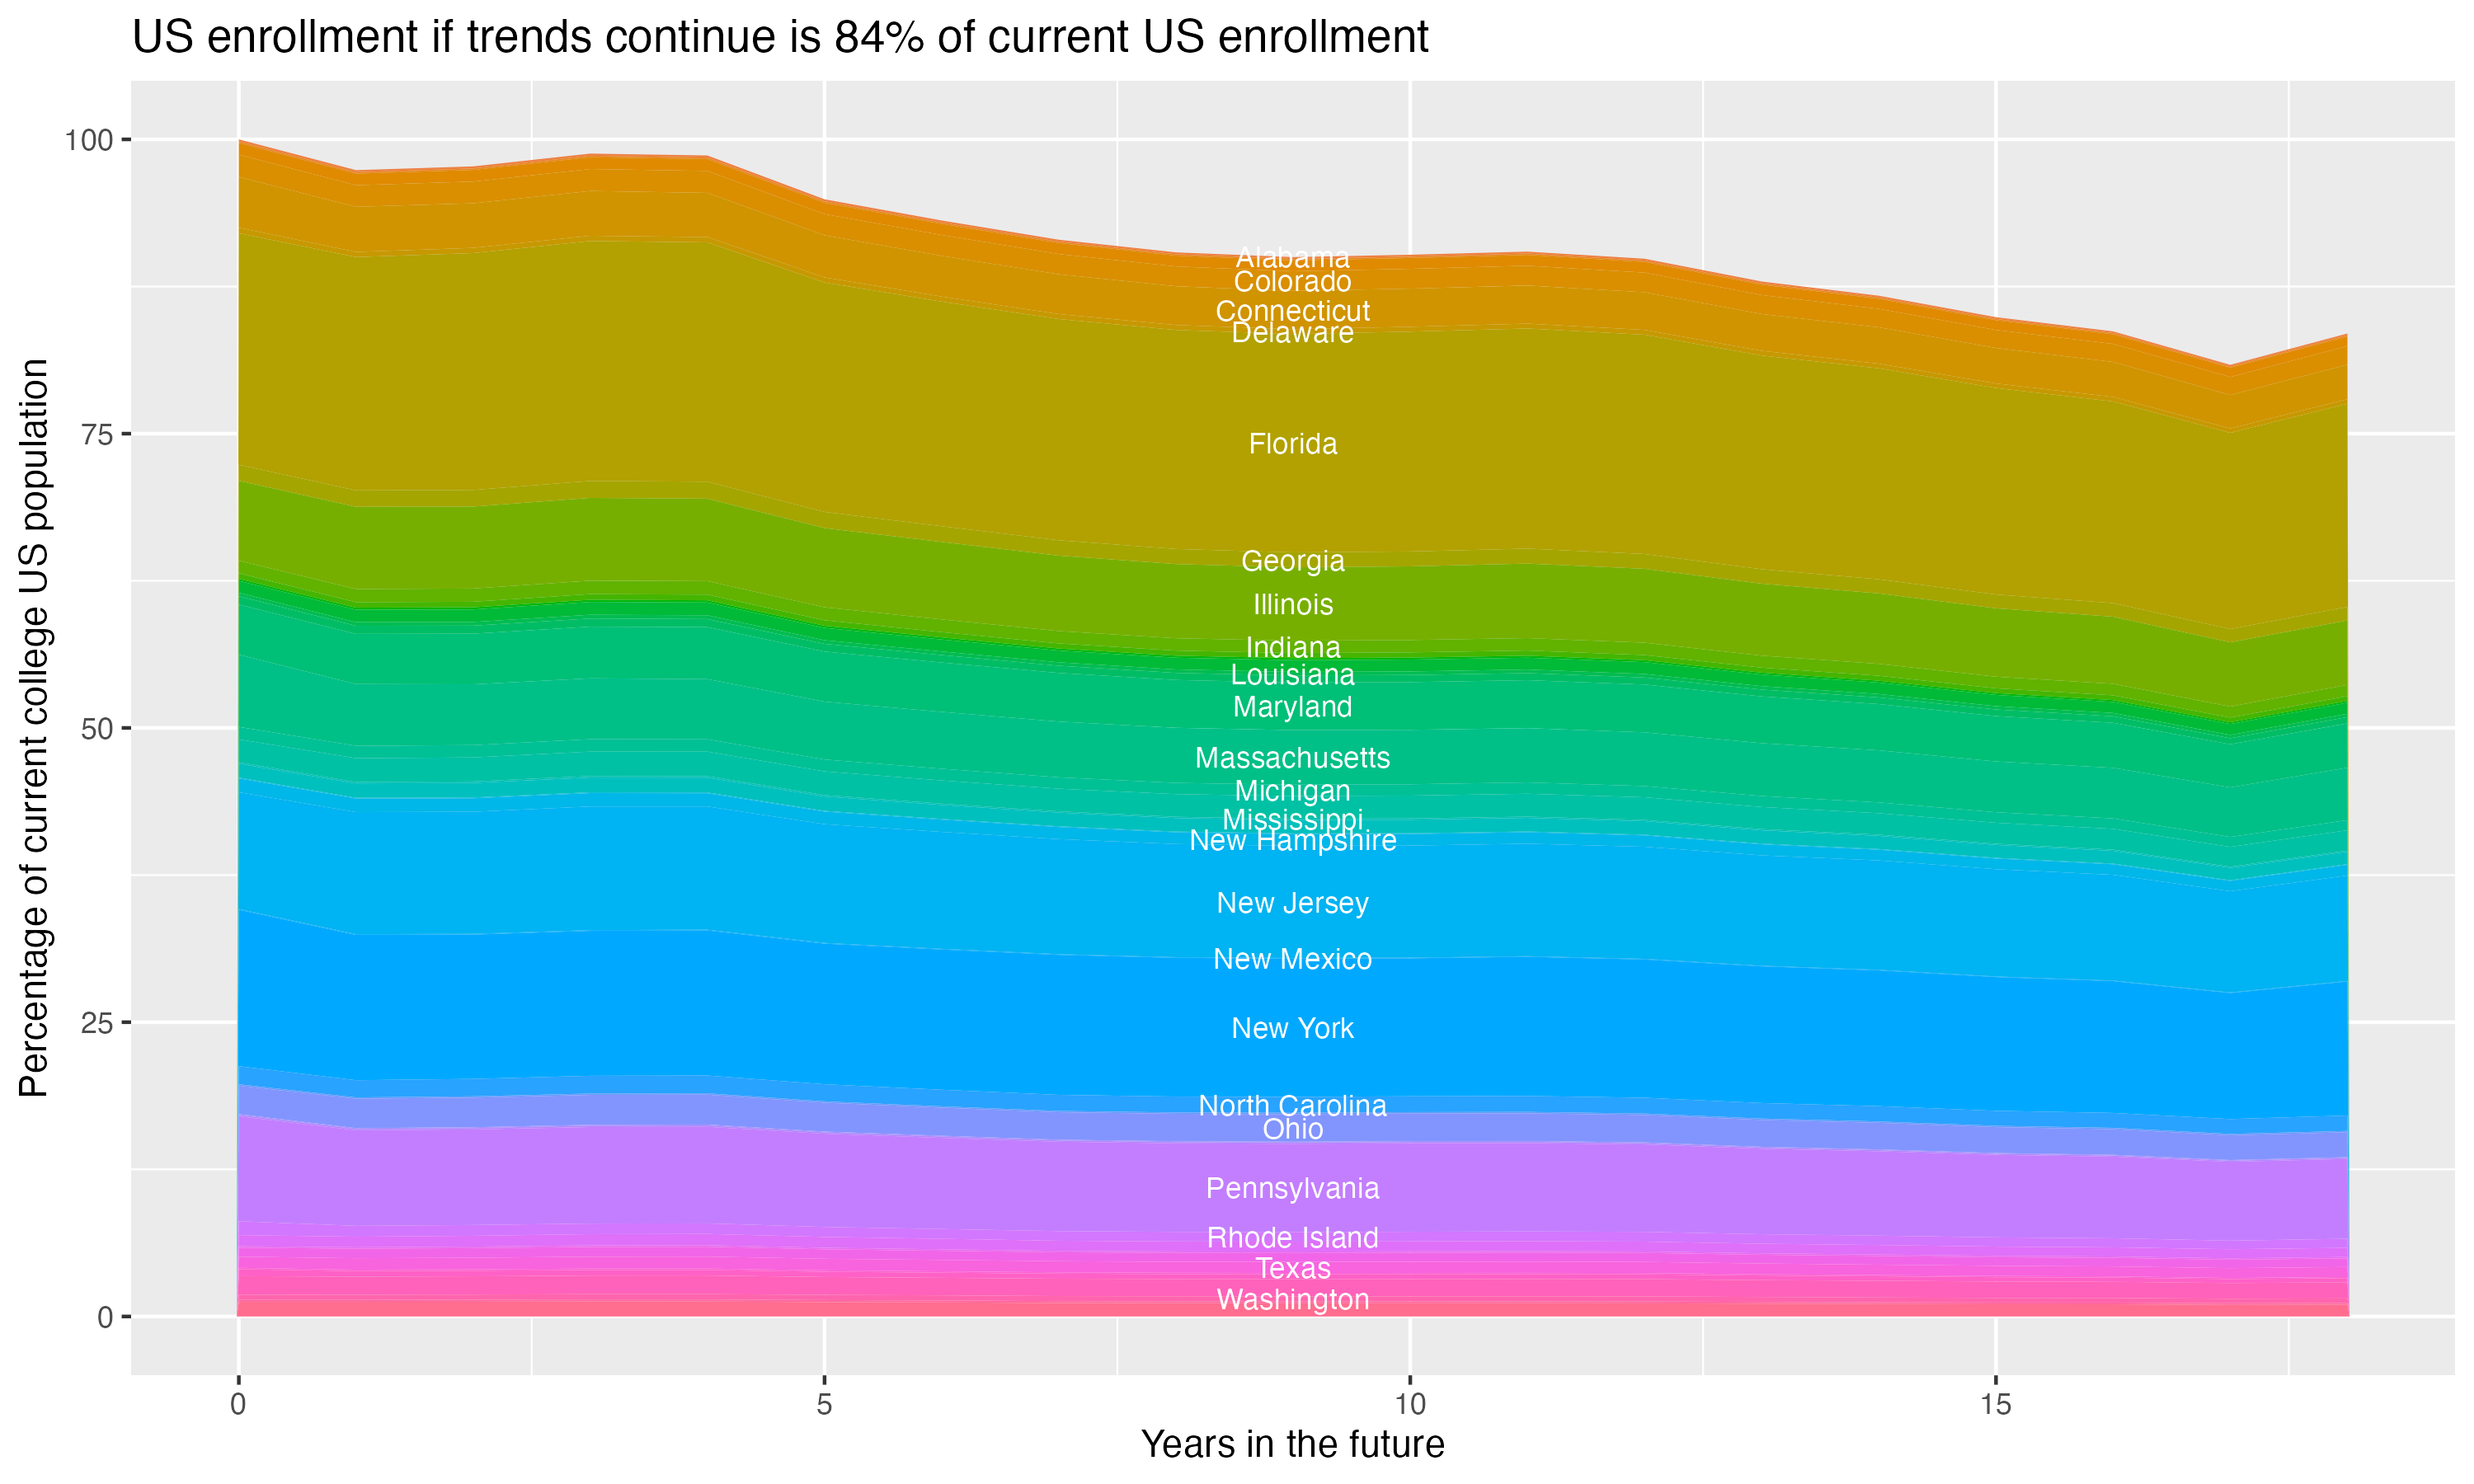
Demographic cliff
There is a concern that giving changing US demographics, the number of students in the age groups who most commonly attend four year colleges will drop off, decreasing overall enrollment. This is often referred to as the “demographic cliff”, and it can be a concern for colleges concerned about the risk of falling enrollment. For this section, the analysis uses US census data on the number of people in each state by age, and the proportion of students that come from each state for this particular college, to crudely model what will happen if everything remains constant except the demographic change in the population of 18 year olds in each year – it does not account for things like the college increasing its admission rate, attracting more students from states without the same demographic changes or from other countries, or changes in the proportion of students who go to college.