Brigham Young University-Idaho
Brigham Young University-Idaho is located in Rexburg, Idaho. It is a private not-for-profit, 4-year or above institution.
From Wikipedia: Brigham Young University–Idaho (BYU–Idaho or BYUI) is a private college in Rexburg, Idaho. Founded 137 years ago in 1888, the college is owned and operated by the Church of Jesus Christ of Latter-day Saints (LDS Church). Previously known as Ricks College, it transitioned from a junior college to a baccalaureate institution in 2001. The college’s focus is on undergraduate education. When it transitioned to a baccalaureate institution in 2001, BYU-Idaho offered about 50 bachelor’s degrees and 19 associate degrees. As of 2024, the institution offers 102 bachelor’s degrees (5 of which are online), 22 associate degrees, and 6 other online degrees. It operates on a three-semester system known as “tracks.” The college is broadly organized into 35 departments within six colleges. Its parent organization, the Church Educational System (CES), sponsors three sister schools—Brigham Young University, Brigham Young University–Hawaii, and Ensign College—as well as the educational organizations Seminaries and Institutes of Religion and BYU-Pathway Worldwide. Clark Gilbert, the CES commissioner, said that each CES higher educational organization has a distinctive role and strategy, with BYU-Idaho being “the teacher”. The vast majority of students are Latter-day Saints. All students attending BYU–Idaho agree to follow an honor code that mandates behavior in line with the church’s teachings. A significant percentage of students take an 18-month (women) or 24-month (men) hiatus from their studies to serve as missionaries. Tuition rates are generally lower than those at similar universities, due largely to funding provided by the church from tithing donations, various scholarships, financial aid, and on-campus student jobs.
Overview of institution
This, and the rest of the page, use info from the most recent year available, generally 2024.
Institution kind: Baccalaureate Colleges: Diverse Fields
Undergrad program: Balanced arts & sciences/professions, no graduate coexistence
Graduate program: Not classified (Exclusively Undergraduate)
Enrollment profile: Exclusively undergraduate four-year (see more details below)
Average net price for undergrads on financial aid: $7,295 . This is 40% the average cost of Harvard.
Actual price for your family: Go here to see what your family may be asked to pay. It can be MUCH lower than the average price but also higher for some.
Size and setting: Four-year, large, primarily nonresidential
In state percentage: 26% of first year students come from Idaho
In US percentage: 97% of first year students come from the US
This institution has a religious affiliation of The Church of Jesus Christ of Latter-day Saints
Graduation rate (within 6 years) for students seeking a Bachelors: 56.1% (this is what is usually reported as “graduation rate”)
Graduation rate (within 4 years) for students seeking a Bachelors: 20.9%
Percent of students seeking a Bachelors who transfer out of this institution: 16.8%
Student to tenure-stream faculty ratio: 32.3 (undergrads to tenure-stream faculty) [Tenure explained]
Student to faculty ratio: 29.6 (undergrads to all faculty)
Degrees offered: Certificate of less than 1 year, Certificate of at least 12 weeks but less than 1 year, Associate’s degree, Bachelor’s degree
Schedule: Semester
Institution provides on campus housing: Yes
Dorm capacity: There are enough dorm beds for 1162 students
Freshmen required to live on campus: No
Advanced placement (AP) credits used: Yes
Disabilities: 3 percent or less of undergrads are registered as having disabilities.
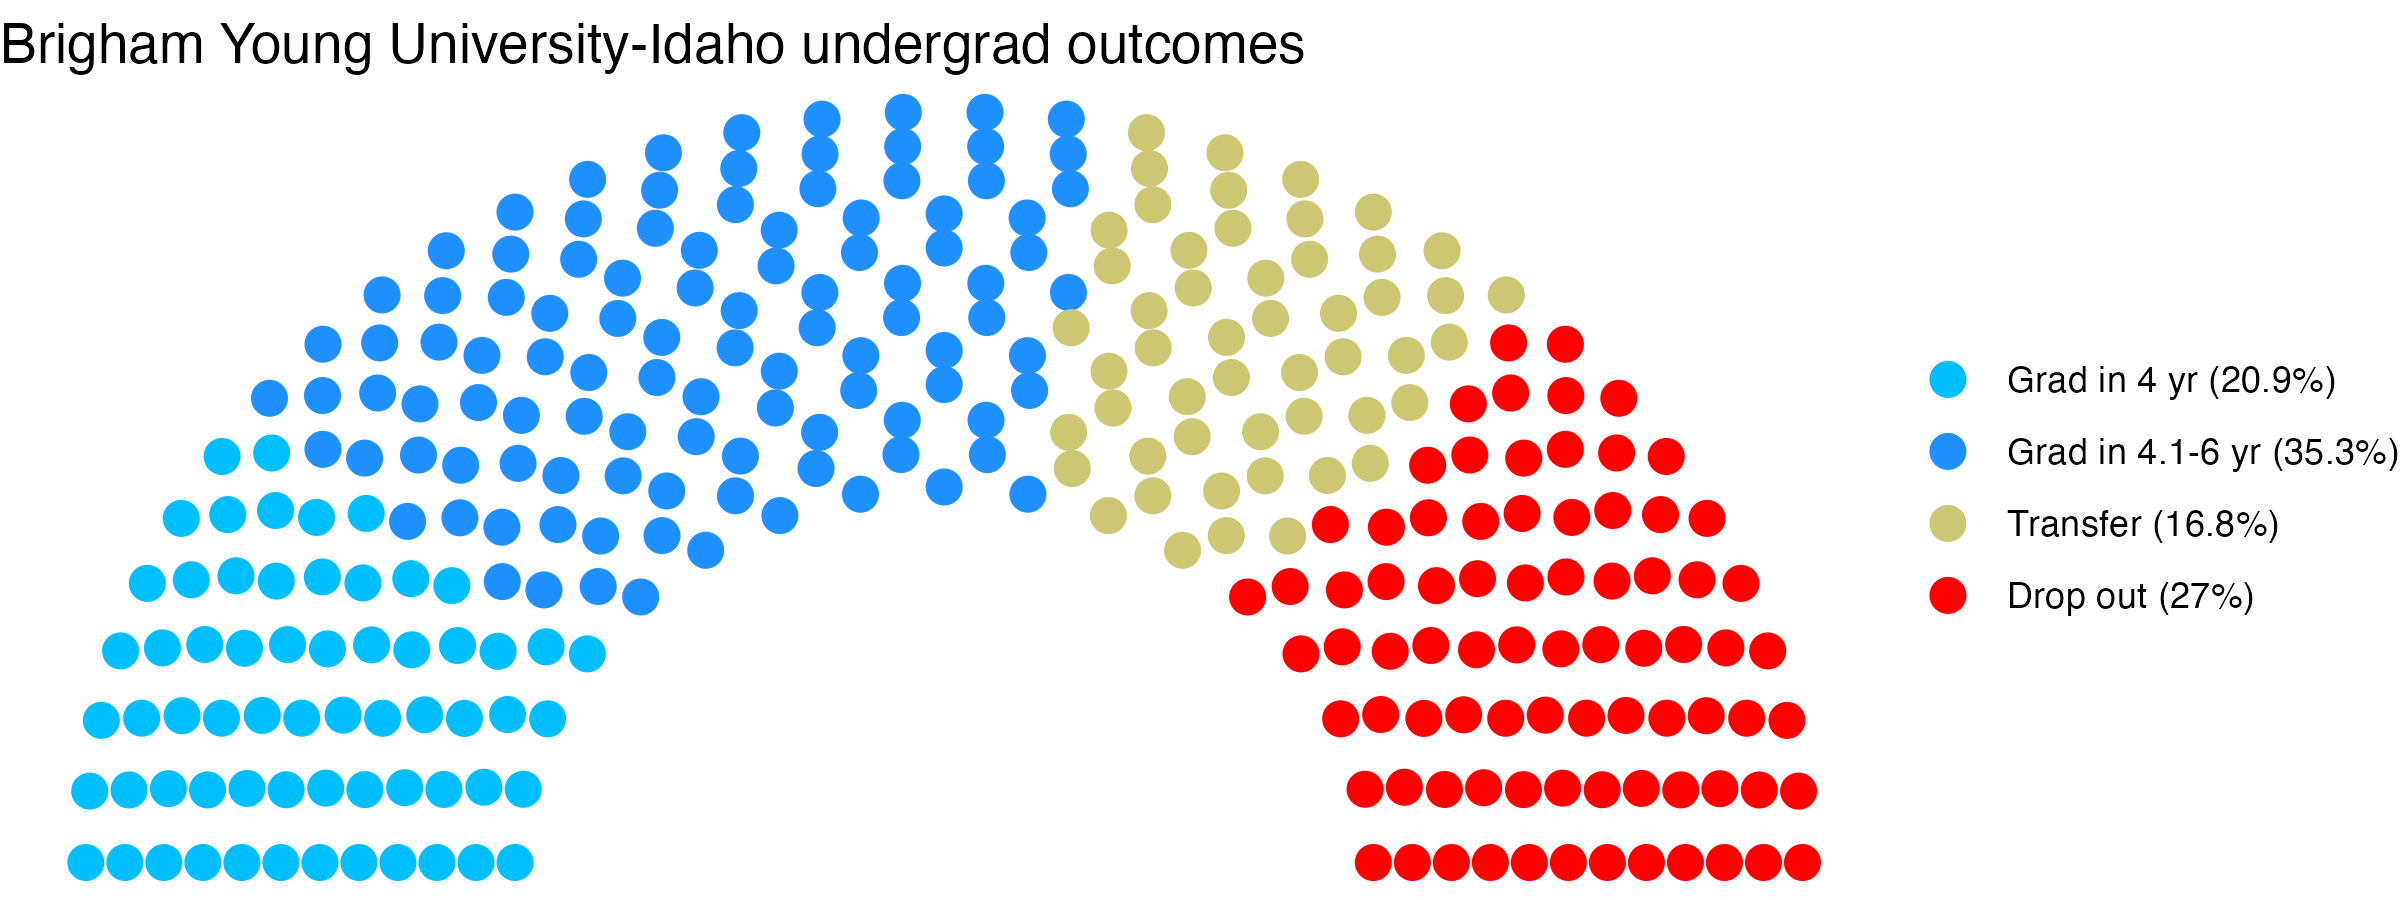
Undergrad outcomes
This plot shows the outcomes for first time, full time undergraduates seeking Bachelor’s degrees (if the data are available).
Map
Comparisons
The sections below show this institution compared with others. The ones listed are ones it has identified as peers, who consider themselves peers, and/or who the federal government considers peers. If a comparison school has the same value as the focal school, its cell is grayed out. In fields where there is a common view that higher (or lower) values are better, the best values are in blue, the worst values are in red. If there isn’t a sense of a particular value being better, values are shown in varying shades of green. Arrows show where there is a signficant trend over time for a school. You can swipe across the table to see more of it; the focal school column is always visible.
- Brigham Young University-Idaho lists these schools as ones to compare itself within federal IPEDS data, and they do the same back: Western Governors University
- Brigham Young University-Idaho compares itself to these institutions, but not vice versa: Brigham Young University, Colorado College, Utah Valley University, Weber State University, Idaho State University, University of Utah, Gonzaga University, University of Denver, Brigham Young University-Hawaii, Boise State University, Utah State University, Montana State University Billings, University of Idaho, Montana State University, Northern Arizona University, Southern Utah University, The College of Idaho, University of Providence, Portland State University, Central Washington University, Carroll College, Northwest Nazarene University, University of Portland, Eastern Washington University, The University of Montana, Regis University, The University of Montana-Western, Rocky Mountain College, Nazarene Bible College, Salish Kootenai College, Westminster University, Colorado Christian University, Naropa University, Denver Seminary
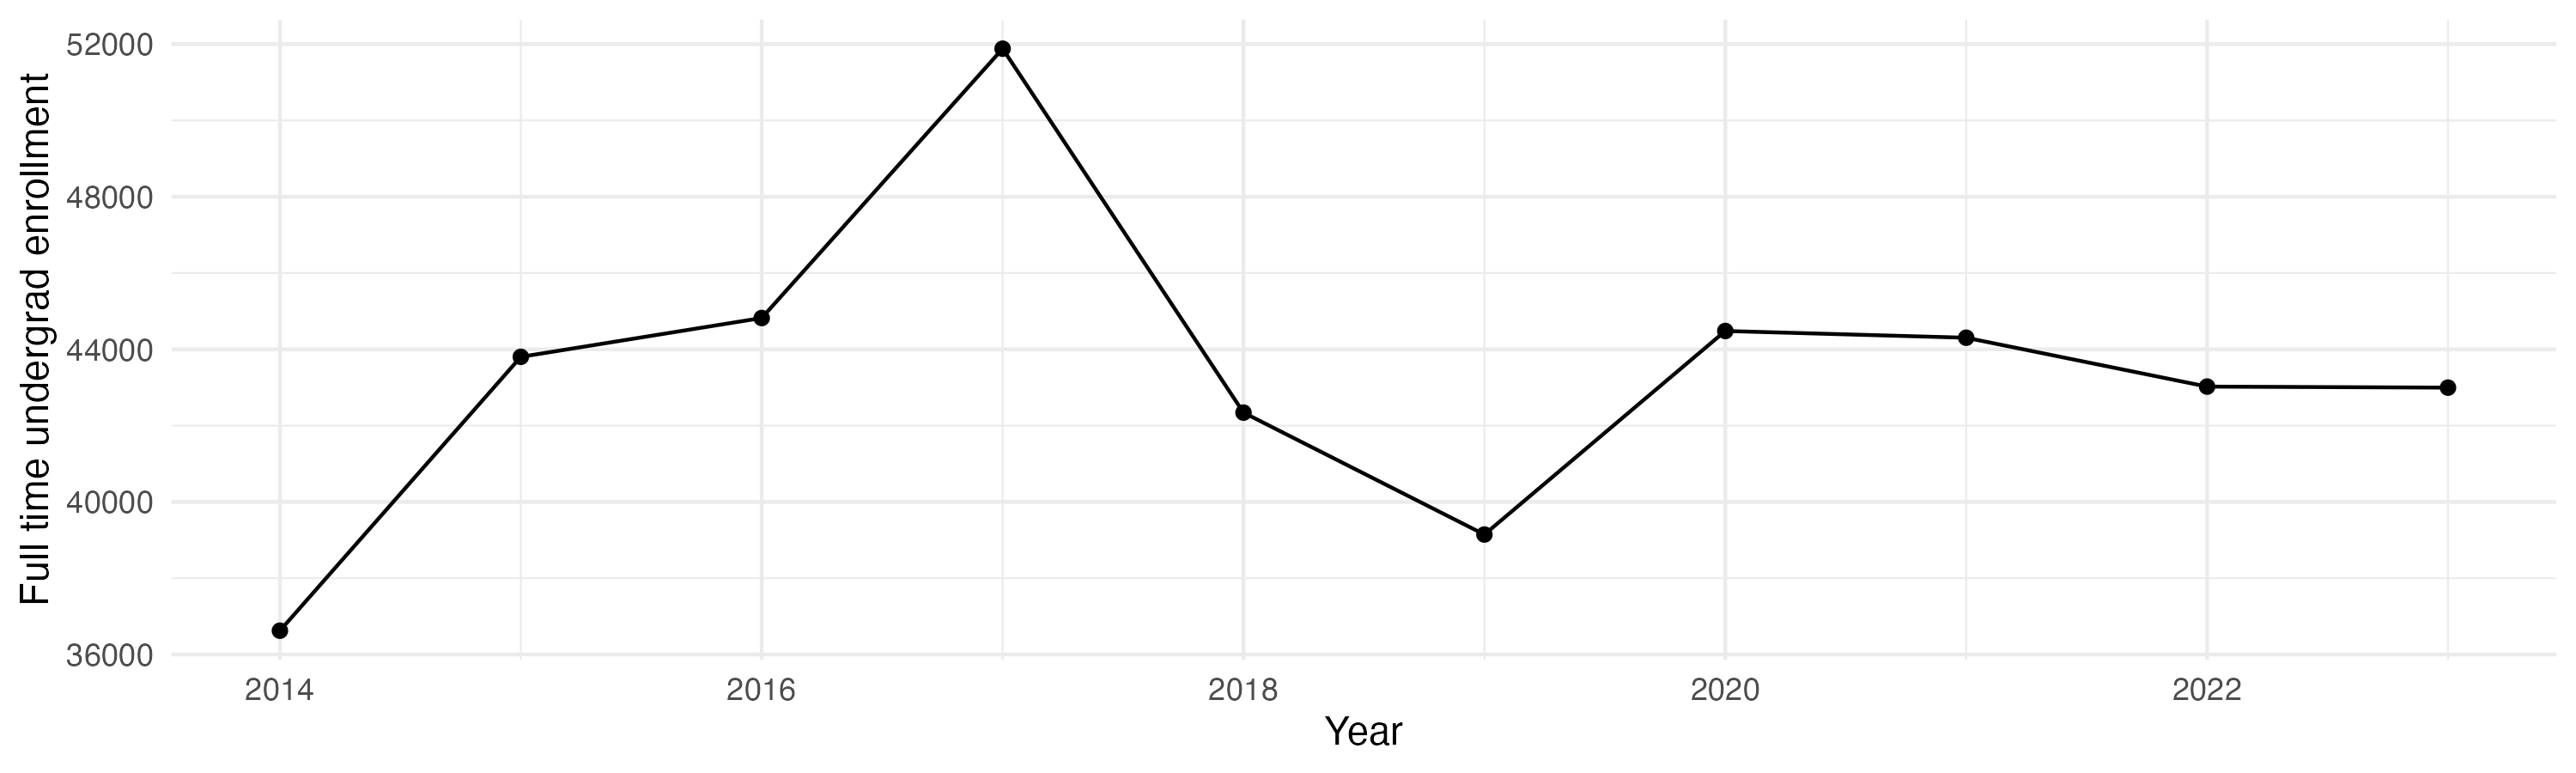
Enrollment
General
Teaching
Tenure track faculty are those who are eligible for tenure. This includes both pre-tenure and tenured faculty. Once faculty get tenure, they are (generally) protected from being fired for intellectual reasons, helping to ensure their freedom in teaching and research. They can still lose their positions for misconduct, financial problems, not fulfilling their duties, or other reasons.
Non-tenure track faculty are not eligible for tenure. Some are hired one semester at a time, some have multi-year contracts. They typically have a higher teaching load than tenure track faculty, leaving less time for research or other creative endeavors. They are also easier to fire than tenured faculty. Sometimes they are external experts (a noted musician, a former senator) who are hired to teach some classes without the expected permanence of a tenure-track position.
Note that this chart uses US federal demographic data: it only has two genders and a specified set of ethnicities and races.
Having a low student to faculty ratio is considered a good thing by many, as it can mean more individual attention.
Geography
This has information on the location of the institution. See the about page for more information on what the metrics are and how they are calculated.
Financial Aid
Graduation
Note these are bachelors graduation rates in six years, not four (this is standard). Sample sizes can be small for some demographic groups with few individuals in a school, leading to large year-to-year fluctuations and often extreme values for those groups (if there are two individuals in the class with a given identity, the possible graduation rates are 0%, 50%, or 100% depending on whether zero, one, or both students graduate within six years).
Library
Libraries are changing rapidly. Note that how institutions count digital collections may vary.
Diversity
The US Census Bureau has a diversity index that goes from 0 to 1. In their words, “A 0-value indicates that everyone in the population has the same racial and ethnic characteristics. A value close to 1 indicates that everyone in the population has different racial and ethnic characteristics.” This uses their formula, but with the resolution available for the federal IPEDS data (which does not separate for a given demographic group whether members identify as Hispanic or not). This metric is about heterogeneity within the population, not the proportion of the population that comes from historically excluded groups.
Following the practice of the census, the index is multiplied by 100 to give the percentage probability a random pair of individuals will have a different background. Most institutions argue that diversity is a benefit, so by default a higher number is listed as better, but there may be cases where this measure does not reflect the mission of a college (for example, 70% of the students at a tribal college or university may be American Indian: that could be low-scoring by this metric but should not be read as “bad” given the institution’s mission).
These numbers are based on the most recent year available, generally 2024, which predates effects of the US Supreme Court’s striking down of affirmative action. This has often changed, sometimes dramatically, the incoming student demographics at some institutions.
Overall diversity
Freshman profile
Demographic data for first time degree-seeking students. Note that this uses US federal demographic data: it only has two genders and a specified set of ethnicities and races.
Freshman geography
Test scores
SAT scores
ACT scores
Majors
This presents information on the number of majors and the median earnings one and five years after graduation for people who got a degree from this institution in that field. The earnings are for those who are working and not enrolled in further education. The earnings data (from the federal college scorecard) also has information on earnings for those categorized as ‘MALE’ and ‘NOMALE’ – for readability, these are recategorized here as “Men” and “Women”, respectively, which adopts the gender binary used in other federal data. “W/M earnings ratio” is the median earnings of women divided by men, as a percentage.
Bachelors
Masters
Doctorate
Certificate
Associates
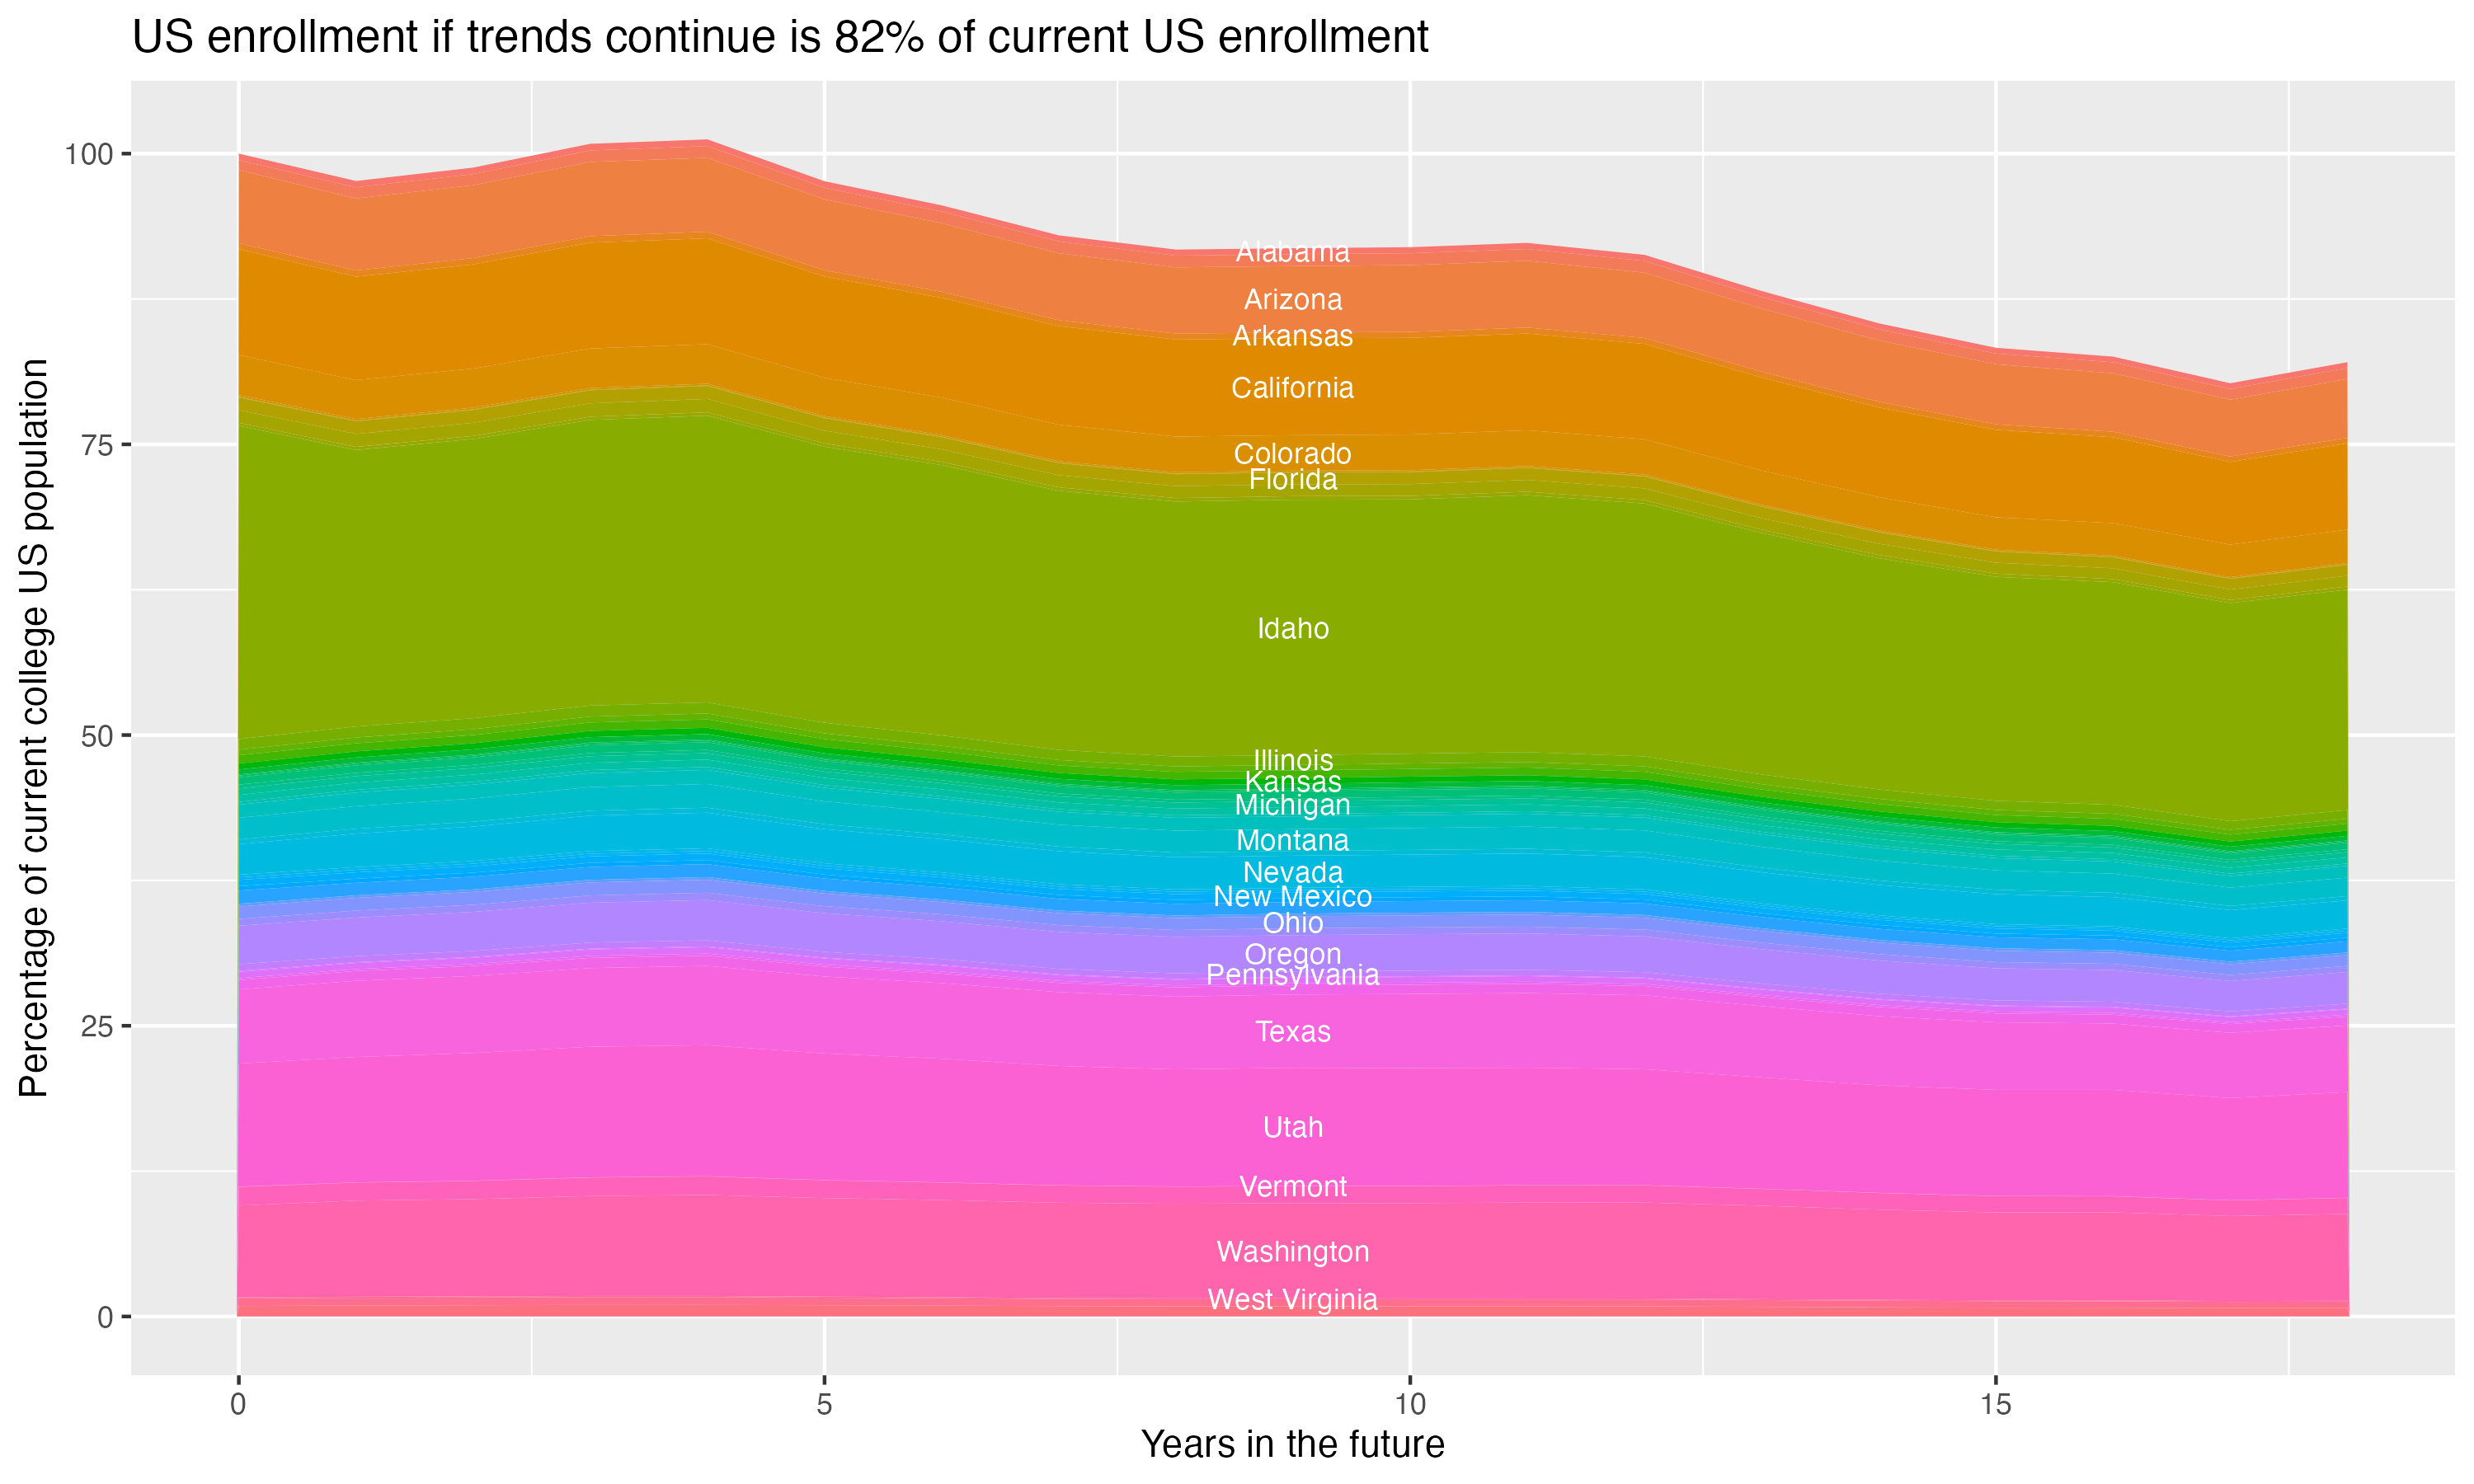
Demographic cliff
There is a concern that giving changing US demographics, the number of students in the age groups who most commonly attend four year colleges will drop off, decreasing overall enrollment. This is often referred to as the “demographic cliff”, and it can be a concern for colleges concerned about the risk of falling enrollment. For this section, the analysis uses US census data on the number of people in each state by age, and the proportion of students that come from each state for this particular college, to crudely model what will happen if everything remains constant except the demographic change in the population of 18 year olds in each year – it does not account for things like the college increasing its admission rate, attracting more students from states without the same demographic changes or from other countries, or changes in the proportion of students who go to college.