Northern Arizona University
Northern Arizona University is located in Flagstaff, Arizona. It is a public, 4-year or above institution.
From Wikipedia: Northern Arizona University (NAU) is a public research university based in Flagstaff, Arizona, United States. Founded in 1899, it was the third and final university established in the Arizona Territory. It is one of the three universities governed by the Arizona Board of Regents and is accredited by the Higher Learning Commission. The university is classified among “R1: Doctoral Universities – Very high research activity”. The university is divided into seven academic colleges offering about 130 undergraduate and graduate programs, and various academic certificates. Students can take classes and conduct research in Flagstaff, online, and at more than 20 statewide locations, including the Phoenix Biomedical Core research campus. As of fall 2023, 28,194 students were enrolled with 21,550 at the Flagstaff campus. NAU is ranked No. 192 in the National Science Foundation (NSF) national research rankings for fiscal year 2023. NAU’s astronomy faculty led the observations of the NASA DART planetary defense mission, co-discovered several astronomical bodies such as Eris and Sedna, and are major participants in the search for the hypothetical Planet Nine. The university is a primary institution of the local Lowell Observatory. Alumni include 4 Truman Scholars, 11 Goldwater Scholars, and 3 Udall Scholars. The NAU Lumberjacks compete in the NCAA Division I primarily as part of the Big Sky Conference, and have won several national championships in cross country running. At an elevation of 6,950 ft (2,120 m) above sea level, the school’s athletic facilities are used by Olympic and professional athletes worldwide for prestige high altitude training.
Overview of institution
This, and the rest of the page, use info from the most recent year available, generally 2024.
Institution kind: Doctoral Universities: Higher Research Activity
Undergrad program: Balanced arts & sciences/professions, some graduate coexistence
Graduate program: Research Doctoral: Comprehensive programs, no medical/veterinary school
Enrollment profile: High undergraduate (see more details below)
Average net price for undergrads on financial aid: $16,544 . This is 90% the average cost of Harvard.
Actual price for your family: Go here to see what your family may be asked to pay. It can be MUCH lower than the average price but also higher for some.
Size and setting: Four-year, large, primarily residential
In state percentage: 79% of first year students come from Arizona
In US percentage: 99% of first year students come from the US
Graduation rate (within 6 years) for students seeking a Bachelors: 56.8% (this is what is usually reported as “graduation rate”)
Graduation rate (within 4 years) for students seeking a Bachelors: 45.4%
Student to tenure-stream faculty ratio: 39.6 (undergrads to tenure-stream faculty) [Tenure explained]
Student to faculty ratio: 18.0 (undergrads to all faculty)
Degrees offered: Certificate of less than 1 year, Certificate of at least 12 weeks but less than 1 year, Certificate of at least 1 year but less than 2 years, Bachelor’s degree, Postbaccalaureate certificate, Master’s degree, Post master’s certificate, Doctor’s degree: research scholarship, Doctor’s degree: professional practice
Schedule: Semester
Institution provides on campus housing: Yes
Dorm capacity: There are enough dorm beds for 9952 students
Freshmen required to live on campus: No
Advanced placement (AP) credits used: Yes
Disabilities: 6.56 percent of undergrads are registered as having disabilities.
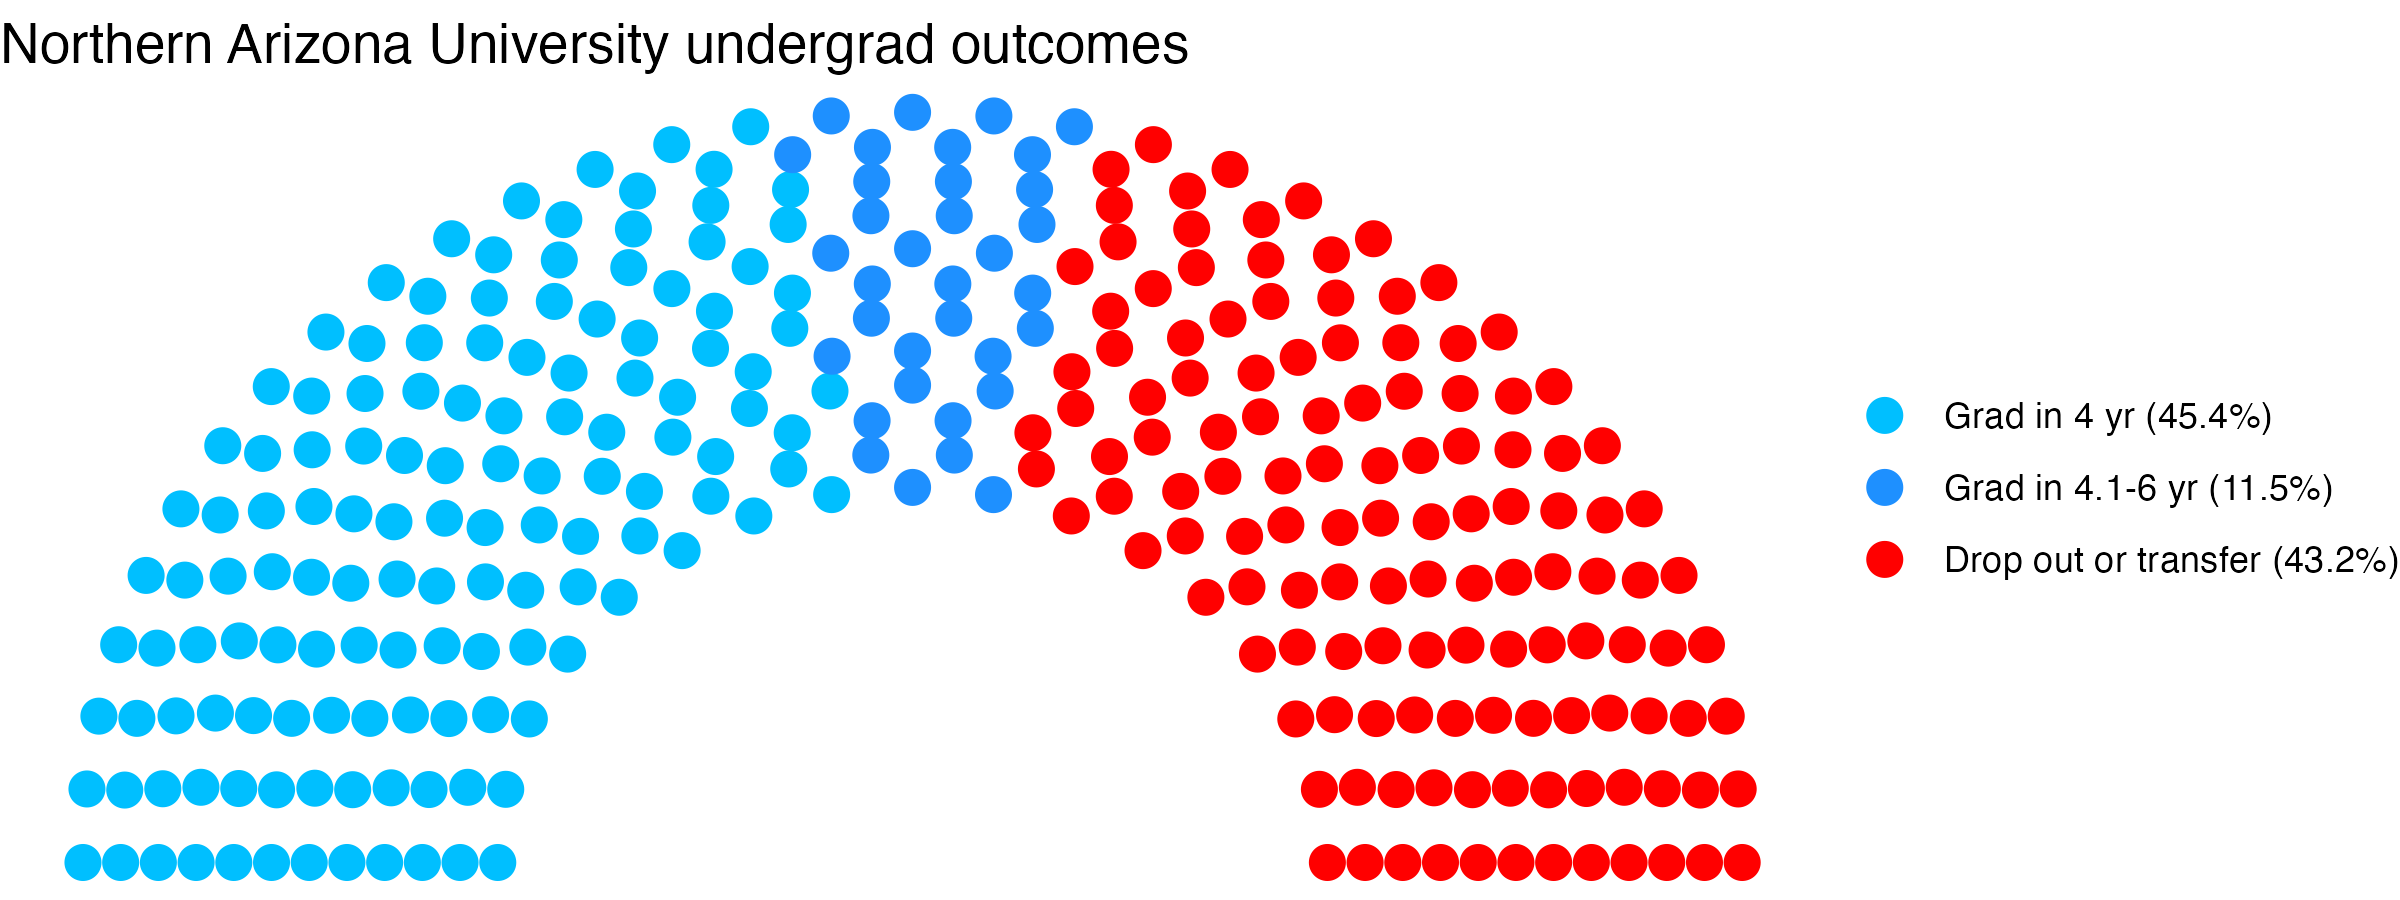
Undergrad outcomes
This plot shows the outcomes for first time, full time undergraduates seeking Bachelor’s degrees (if the data are available).
Map
Comparisons
The sections below show this institution compared with others. The ones listed are ones it has identified as peers, who consider themselves peers, and/or who the federal government considers peers. If a comparison school has the same value as the focal school, its cell is grayed out. In fields where there is a common view that higher (or lower) values are better, the best values are in blue, the worst values are in red. If there isn’t a sense of a particular value being better, values are shown in varying shades of green. Arrows show where there is a signficant trend over time for a school. You can swipe across the table to see more of it; the focal school column is always visible.
- Northern Arizona University lists these schools as ones to compare itself within federal IPEDS data, and they do the same back: University of Vermont, Idaho State University, University of North Carolina at Charlotte, Ball State University, Texas State University, Bowling Green State University-Main Campus, East Carolina University, Sam Houston State University, University of North Carolina at Greensboro, Rutgers University-Newark, Old Dominion University
- Northern Arizona University compares itself to these institutions, but not vice versa: University of Central Florida, Clemson University, William & Mary, San Diego State University, University of Puerto Rico-Rio Piedras, Auburn University, Binghamton University, Florida International University, Florida Agricultural and Mechanical University, Texas Tech University, University of Arkansas, Oklahoma State University-Main Campus, University of Oklahoma-Norman Campus, University of Houston, The University of Alabama, The University of Texas at Dallas, University of California-Merced, University of North Georgia, University of North Texas, Kansas State University, Georgia State University, North Carolina A & T State University, University of Alaska Fairbanks, University of Nevada-Reno, Florida Atlantic University, Miami University-Oxford, Mississippi State University, New Jersey Institute of Technology, Temple University, George Mason University, University of Maryland-Baltimore County, University of Rhode Island, The University of Texas at Arlington, West Virginia University, University of Oregon, Indiana University-Indianapolis, University of North Dakota, Towson University, Louisiana Tech University, Virginia Commonwealth University, Ohio University-Main Campus, University of Louisville, Illinois State University, Kent State University at Kent, University of South Alabama, University of New Hampshire-Main Campus, University of Nevada-Las Vegas, The University of Texas at San Antonio, University of Massachusetts-Lowell, Utah State University, University of Missouri-St Louis, University of Missouri-Kansas City, University of Alabama in Huntsville, University of Mississippi, University of Colorado Denver/Anschutz Medical Campus, Missouri University of Science and Technology, New Mexico State University-Main Campus, University of Akron Main Campus, North Dakota State University-Main Campus, University of Idaho, Northern Illinois University, University of Louisiana at Lafayette, Montana State University, South Dakota State University, Western Michigan University, University of Wisconsin-Milwaukee, University of Wyoming, The University of Texas at El Paso, Michigan Technological University, Portland State University, University of Massachusetts-Boston, Central Michigan University, University of Toledo, Southern Illinois University-Carbondale, University of Memphis, University of South Dakota, University of New Orleans, Wichita State University, University of Maine, University of Southern Mississippi, SUNY College of Environmental Science and Forestry, Augusta University, University of Northern Colorado, Cleveland State University, The University of Montana, University of Massachusetts-Dartmouth, East Texas A&M University, CUNY Graduate School and University Center, Wright State University-Main Campus, Jackson State University
- These institutions compare themselves to Northern Arizona University, but not vice versa: University of Puerto Rico-Mayaguez, James Madison University, California State Polytechnic University-Pomona, Rowan University, Brigham Young University-Idaho, St. John’s University-New York, University of Northern Iowa, Southern Illinois University Edwardsville, DeVry University-Arizona, Adams State University, University of Advancing Technology
Enrollment
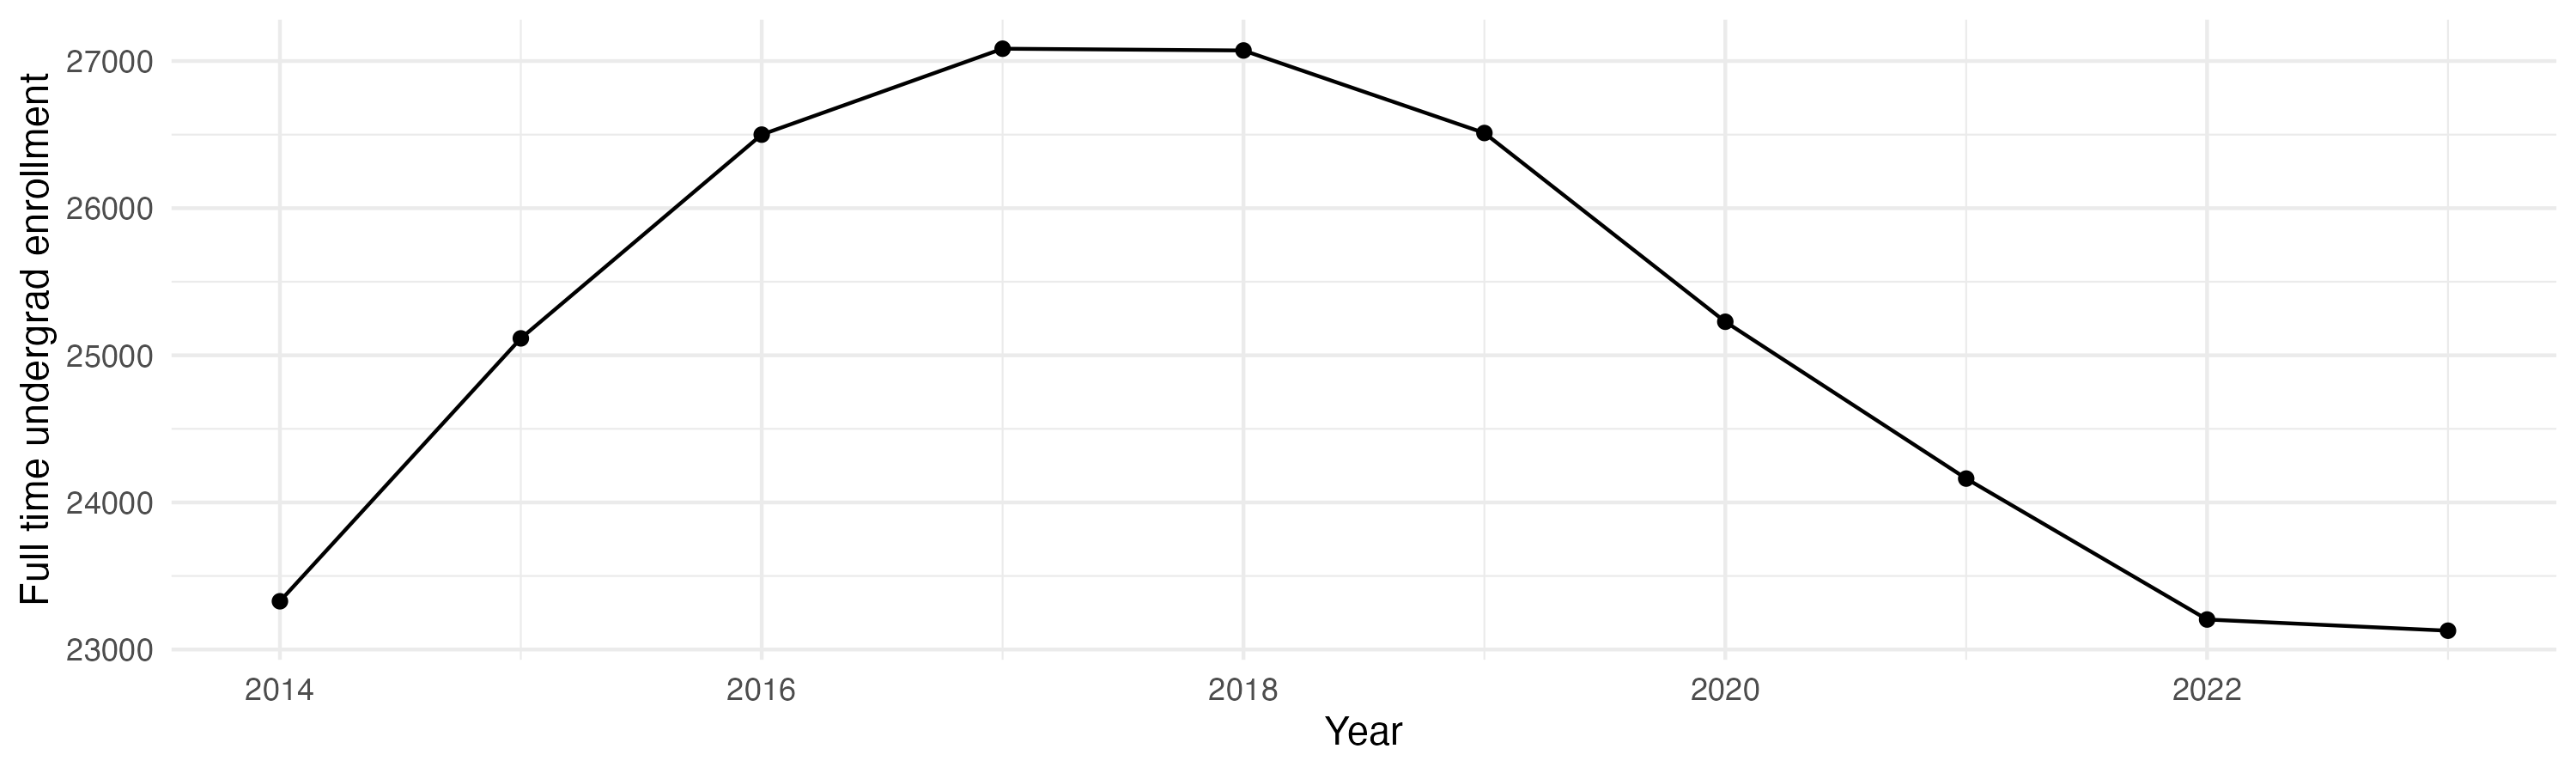
General
Teaching
Tenure track faculty are those who are eligible for tenure. This includes both pre-tenure and tenured faculty. Once faculty get tenure, they are (generally) protected from being fired for intellectual reasons, helping to ensure their freedom in teaching and research. They can still lose their positions for misconduct, financial problems, not fulfilling their duties, or other reasons.
Non-tenure track faculty are not eligible for tenure. Some are hired one semester at a time, some have multi-year contracts. They typically have a higher teaching load than tenure track faculty, leaving less time for research or other creative endeavors. They are also easier to fire than tenured faculty. Sometimes they are external experts (a noted musician, a former senator) who are hired to teach some classes without the expected permanence of a tenure-track position.
Note that this chart uses US federal demographic data: it only has two genders and a specified set of ethnicities and races.
Having a low student to faculty ratio is considered a good thing by many, as it can mean more individual attention.
Geography
This has information on the location of the institution. See the about page for more information on what the metrics are and how they are calculated.
Financial Aid
Graduation
Note these are bachelors graduation rates in six years, not four (this is standard). Sample sizes can be small for some demographic groups with few individuals in a school, leading to large year-to-year fluctuations and often extreme values for those groups (if there are two individuals in the class with a given identity, the possible graduation rates are 0%, 50%, or 100% depending on whether zero, one, or both students graduate within six years).
Library
Libraries are changing rapidly. Note that how institutions count digital collections may vary.
Diversity
The US Census Bureau has a diversity index that goes from 0 to 1. In their words, “A 0-value indicates that everyone in the population has the same racial and ethnic characteristics. A value close to 1 indicates that everyone in the population has different racial and ethnic characteristics.” This uses their formula, but with the resolution available for the federal IPEDS data (which does not separate for a given demographic group whether members identify as Hispanic or not). This metric is about heterogeneity within the population, not the proportion of the population that comes from historically excluded groups.
Following the practice of the census, the index is multiplied by 100 to give the percentage probability a random pair of individuals will have a different background. Most institutions argue that diversity is a benefit, so by default a higher number is listed as better, but there may be cases where this measure does not reflect the mission of a college (for example, 70% of the students at a tribal college or university may be American Indian: that could be low-scoring by this metric but should not be read as “bad” given the institution’s mission).
These numbers are based on the most recent year available, generally 2024, which predates effects of the US Supreme Court’s striking down of affirmative action. This has often changed, sometimes dramatically, the incoming student demographics at some institutions.
Overall diversity
Freshman profile
Demographic data for first time degree-seeking students. Note that this uses US federal demographic data: it only has two genders and a specified set of ethnicities and races.
Freshman geography
Test scores
SAT scores
ACT scores
Majors
This presents information on the number of majors and the median earnings one and five years after graduation for people who got a degree from this institution in that field. The earnings are for those who are working and not enrolled in further education. The earnings data (from the federal college scorecard) also has information on earnings for those categorized as ‘MALE’ and ‘NOMALE’ – for readability, these are recategorized here as “Men” and “Women”, respectively, which adopts the gender binary used in other federal data. “W/M earnings ratio” is the median earnings of women divided by men, as a percentage.
Bachelors
Masters
Doctorate
Certificate
Associates
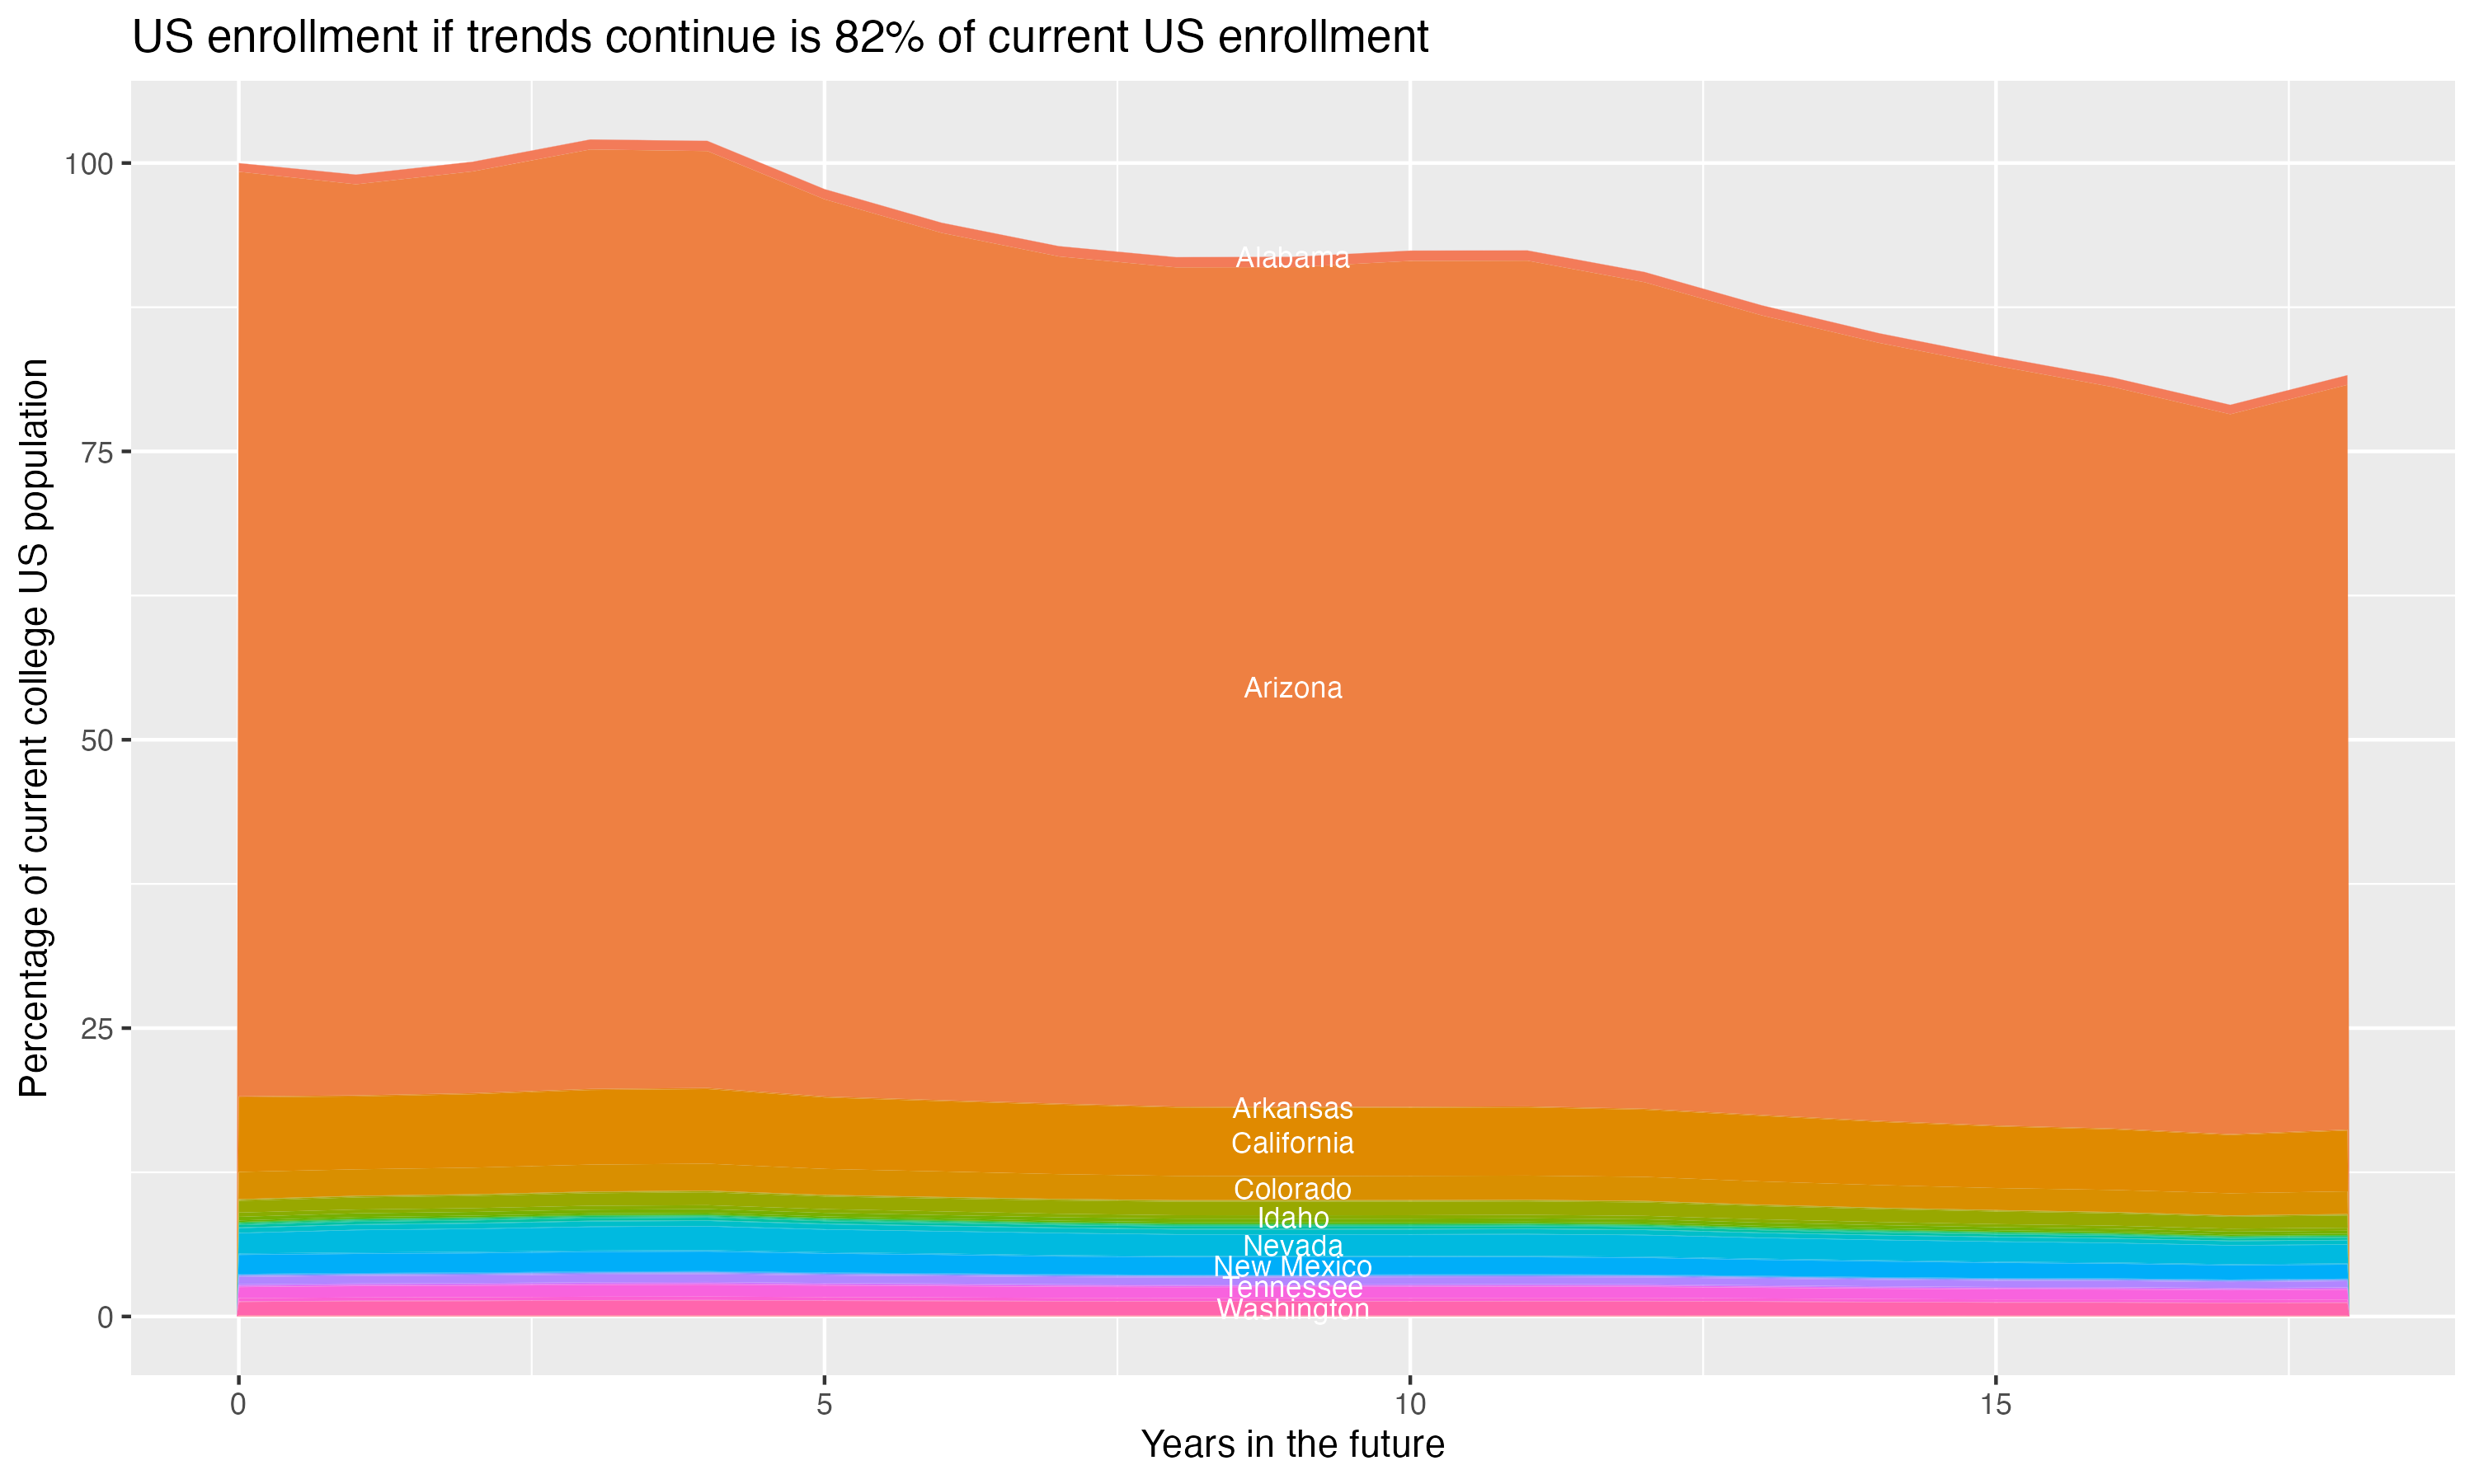
Demographic cliff
There is a concern that giving changing US demographics, the number of students in the age groups who most commonly attend four year colleges will drop off, decreasing overall enrollment. This is often referred to as the “demographic cliff”, and it can be a concern for colleges concerned about the risk of falling enrollment. For this section, the analysis uses US census data on the number of people in each state by age, and the proportion of students that come from each state for this particular college, to crudely model what will happen if everything remains constant except the demographic change in the population of 18 year olds in each year – it does not account for things like the college increasing its admission rate, attracting more students from states without the same demographic changes or from other countries, or changes in the proportion of students who go to college.