Washington University in St Louis
Washington University in St Louis is located in St. Louis, Missouri. It is a private not-for-profit, 4-year or above institution.
From Wikipedia: Washington University in St. Louis (WashU) is a private research university in St. Louis, Missouri, United States. Founded in 1853 by a group of civic leaders and named for George Washington, the university spans 355 acres across its Danforth and Medical campuses. It comprises nine schools and offers more than 150 undergraduate, 80 master’s and professional, and 50 doctoral degree programs. As of 2024, Washington University enrolled 16,399 students representing all 50 United States states and more than 110 countries. Established due to a concern of a lack of institutions of higher learning in the Midwest, the university held its first classes in 1854 in downtown St. Louis. In 1905, Washington University relocated to a new campus northwest of Forest Park, which allowed for expansion and new facilities to support its growing academic programs and student body. Construction of the first building, Busch Hall, began in 1900, followed by Brookings Hall, Ridgley, and Cupples. These buildings were not occupied until 1905 in order to accommodate the 1904 Summer Olympics and St. Louis World’s Fair. By 1964, more than two-thirds of incoming students came from outside the St. Louis area. In 2021, the university adopted a need-blind undergraduate-admissions policy. Washington University joined the Association of American Universities in 1923. The university received over 32,750 applications for the Class of 2028 and admitted 12 percent. It supports more than 400 undergraduate student organizations. The university’s athletic teams, the Washington University Bears, compete in NCAA Division III as founding members of the University Athletic Association and as a member of the College Conference of Illinois and Wisconsin. Its mascot is the Bear, and its official colors are red and green. The Bears have won 26 NCAA Division III championships. Governance of the university is overseen by a Board of Trustees, which ensures its alignment with educational, financial, and social objectives. As of 2024, the university is led by Chancellor Andrew D. Martin and Provost Beverly Wendland. The university’s endowment of $12.0 billion is among the fifteen largest in the United States. The university’s motto is Per veritatem vis, which translates to “Strength through truth”. It is accredited by the Higher Learning Commission. Washington University has been the venue for four presidential debates and one vice-presidential debate. As of 2024, 26 Nobel laureates, 11 Pulitzer Prize winners, 4 United States Poets Laureate, and 6 MacArthur Fellows have been affiliated with the university as faculty or alumni. A top producer of Fulbright scholars, Washington University alumni also include 17 university presidents, 21 members of the United States Congress, and 30 Rhodes Scholars.
Overview of institution
This, and the rest of the page, use info from the most recent year available, generally 2024.
Institution kind: Doctoral Universities: Highest Research Activity
Undergrad program: Arts & sciences plus professions, high graduate coexistence
Graduate program: Research Doctoral: Comprehensive programs, with medical/veterinary school
Enrollment profile: Majority undergraduate (see more details below)
Average net price for undergrads on financial aid: $22,440 (1.3 times the equivalent cost of Harvard).
Actual price for your family: Go here to see what your family may be asked to pay. It can be MUCH lower than the average price but also higher for some.
Size and setting: Four-year, large, highly residential
In state percentage: 12% of first year students come from Missouri
In US percentage: 88% of first year students come from the US
Graduation rate (within 6 years) for students seeking a Bachelors: 94.4% (this is what is usually reported as “graduation rate”)
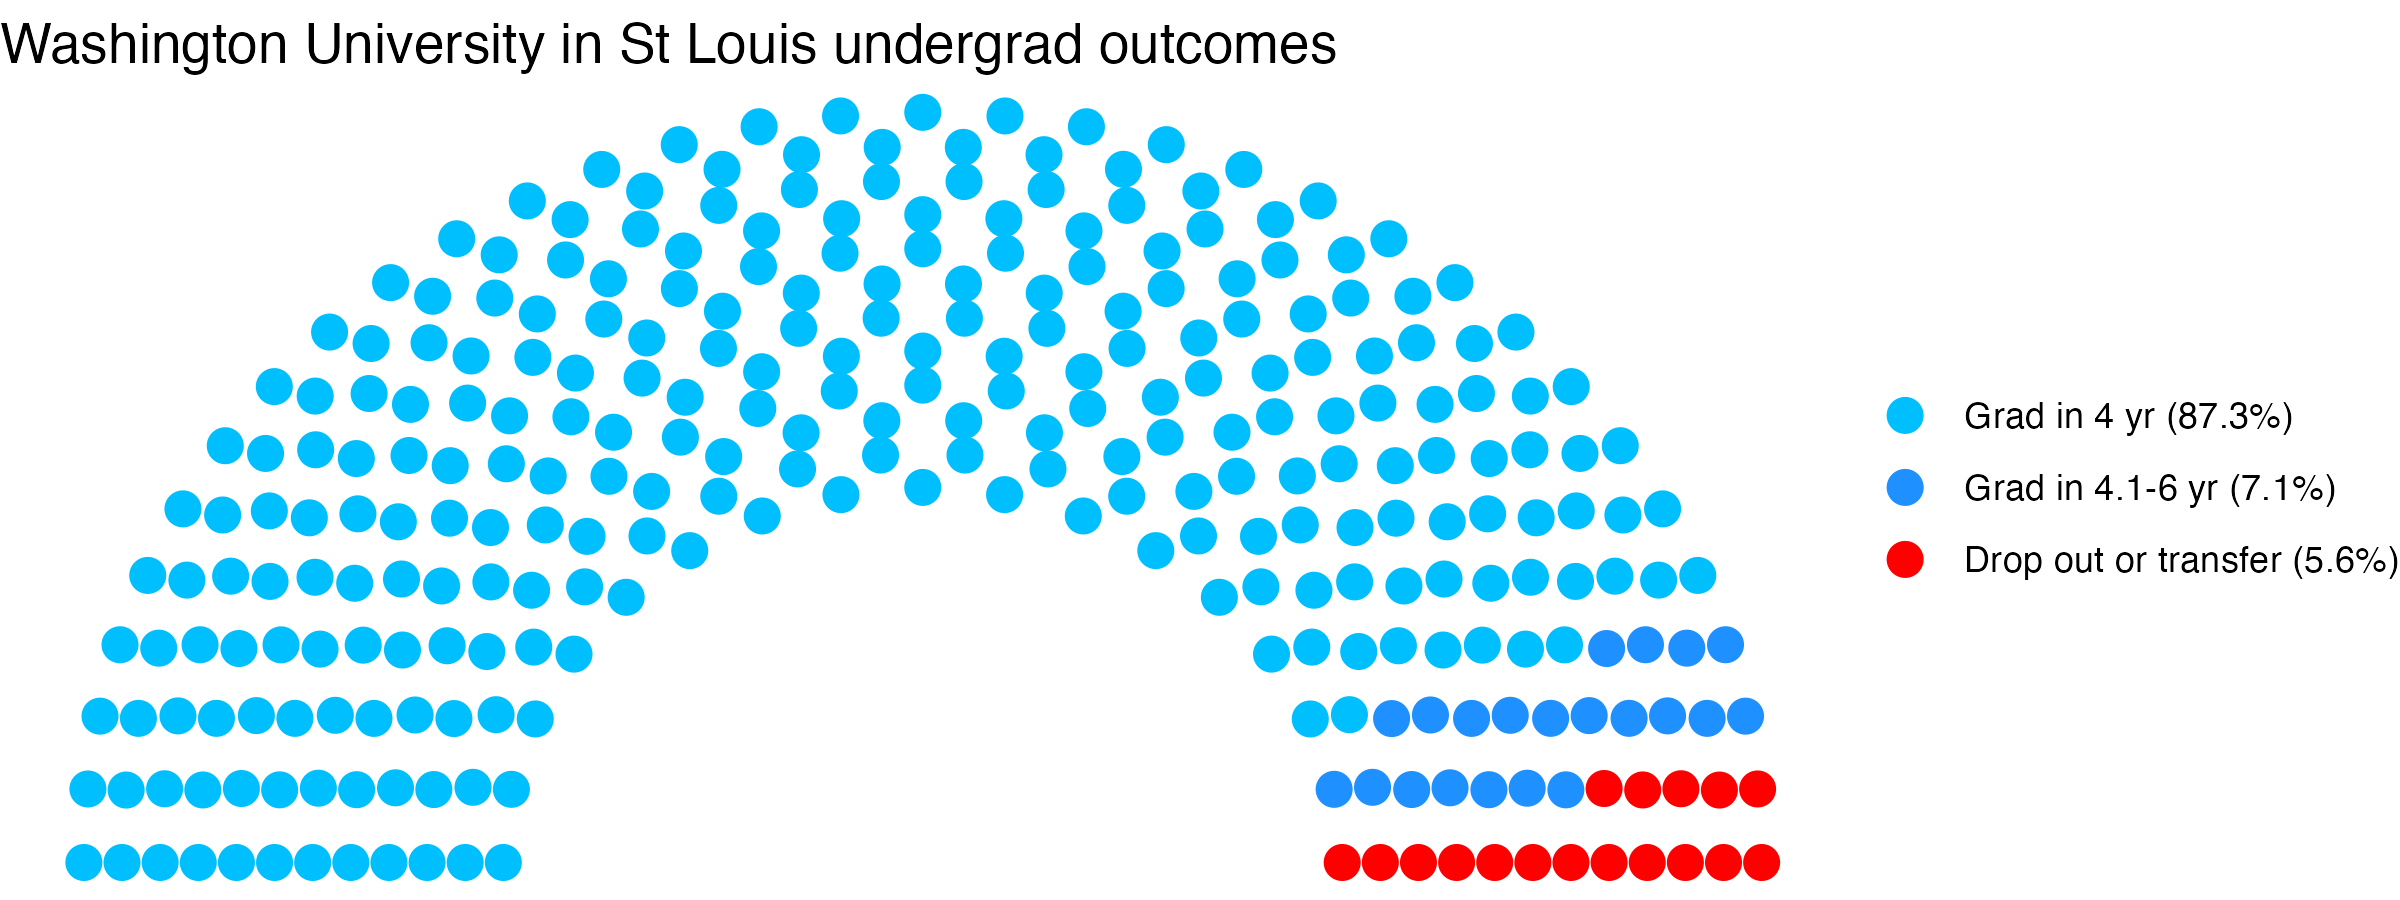
Graduation rate (within 4 years) for students seeking a Bachelors: 87.3%
Student to tenure-stream faculty ratio: 5.1 (undergrads to tenure-stream faculty) [Tenure explained]
Student to faculty ratio: 4.0 (undergrads to all faculty)
Degrees offered: Certificate of less than 1 year, Certificate of less than 12 weeks, Certificate of at least 12 weeks but less than 1 year, Certificate of at least 1 year but less than 2 years, Associate’s degree, Certificate of at least 2 years but less than 4 years, Bachelor’s degree, Postbaccalaureate certificate, Master’s degree, Doctor’s degree: research scholarship, Doctor’s degree: professional practice
Schedule: Semester
Institution provides on campus housing: Yes
Dorm capacity: There are enough dorm beds for 7032 students
Freshmen required to live on campus: No
Advanced placement (AP) credits used: Yes
Disabilities: 12.83 percent of undergrads are registered as having disabilities.
Undergrad outcomes
This plot shows the outcomes for first time, full time undergraduates seeking Bachelor’s degrees (if the data are available).
Map
Comparisons
The sections below show this institution compared with others. The ones listed are ones it has identified as peers, who consider themselves peers, and/or who the federal government considers peers. If a comparison school has the same value as the focal school, its cell is grayed out. In fields where there is a common view that higher (or lower) values are better, the best values are in blue, the worst values are in red. If there isn’t a sense of a particular value being better, values are shown in varying shades of green. Arrows show where there is a signficant trend over time for a school. You can swipe across the table to see more of it; the focal school column is always visible.
- Washington University in St Louis lists these schools as ones to compare itself within federal IPEDS data, and they do the same back: University of Chicago, Cornell University, New York University, Northwestern University, Brown University, Johns Hopkins University, Vanderbilt University, University of Southern California, Rice University, Carnegie Mellon University, Emory University, Tulane University of Louisiana, University of Rochester, Case Western Reserve University, Brandeis University
- Washington University in St Louis compares itself to these institutions, but not vice versa: Harvard University, Stanford University, Massachusetts Institute of Technology, University of Pennsylvania, Yale University, Princeton University, Columbia University in the City of New York, Duke University, Boston University, California Institute of Technology
- These institutions compare themselves to Washington University in St Louis, but not vice versa: University of Michigan-Ann Arbor, University of Notre Dame, University of Virginia-Main Campus, Tufts University, Boston College, Bowdoin College, Wellesley College, William & Mary, Syracuse University, George Washington University, American University, Bentley University, University of Tulsa, Florida Institute of Technology, University of Massachusetts Chan Medical School
Enrollment

General
Teaching
Tenure track faculty are those who are eligible for tenure. This includes both pre-tenure and tenured faculty. Once faculty get tenure, they are (generally) protected from being fired for intellectual reasons, helping to ensure their freedom in teaching and research. They can still lose their positions for misconduct, financial problems, not fulfilling their duties, or other reasons.
Non-tenure track faculty are not eligible for tenure. Some are hired one semester at a time, some have multi-year contracts. They typically have a higher teaching load than tenure track faculty, leaving less time for research or other creative endeavors. They are also easier to fire than tenured faculty. Sometimes they are external experts (a noted musician, a former senator) who are hired to teach some classes without the expected permanence of a tenure-track position.
Note that this chart uses US federal demographic data: it only has two genders and a specified set of ethnicities and races.
Having a low student to faculty ratio is considered a good thing by many, as it can mean more individual attention.
Geography
This has information on the location of the institution. See the about page for more information on what the metrics are and how they are calculated.
Financial Aid
Graduation
Note these are bachelors graduation rates in six years, not four (this is standard). Sample sizes can be small for some demographic groups with few individuals in a school, leading to large year-to-year fluctuations and often extreme values for those groups (if there are two individuals in the class with a given identity, the possible graduation rates are 0%, 50%, or 100% depending on whether zero, one, or both students graduate within six years).
Library
Libraries are changing rapidly. Note that how institutions count digital collections may vary.
Diversity
The US Census Bureau has a diversity index that goes from 0 to 1. In their words, “A 0-value indicates that everyone in the population has the same racial and ethnic characteristics. A value close to 1 indicates that everyone in the population has different racial and ethnic characteristics.” This uses their formula, but with the resolution available for the federal IPEDS data (which does not separate for a given demographic group whether members identify as Hispanic or not). This metric is about heterogeneity within the population, not the proportion of the population that comes from historically excluded groups.
Following the practice of the census, the index is multiplied by 100 to give the percentage probability a random pair of individuals will have a different background. Most institutions argue that diversity is a benefit, so by default a higher number is listed as better, but there may be cases where this measure does not reflect the mission of a college (for example, 70% of the students at a tribal college or university may be American Indian: that could be low-scoring by this metric but should not be read as “bad” given the institution’s mission).
These numbers are based on the most recent year available, generally 2024, which predates effects of the US Supreme Court’s striking down of affirmative action. This has often changed, sometimes dramatically, the incoming student demographics at some institutions.
Overall diversity
Freshman profile
Demographic data for first time degree-seeking students. Note that this uses US federal demographic data: it only has two genders and a specified set of ethnicities and races.
Freshman geography
Test scores
SAT scores
ACT scores
Majors
This presents information on the number of majors and the median earnings one and five years after graduation for people who got a degree from this institution in that field. The earnings are for those who are working and not enrolled in further education. The earnings data (from the federal college scorecard) also has information on earnings for those categorized as ‘MALE’ and ‘NOMALE’ – for readability, these are recategorized here as “Men” and “Women”, respectively, which adopts the gender binary used in other federal data. “W/M earnings ratio” is the median earnings of women divided by men, as a percentage.
Bachelors
Masters
Doctorate
Certificate
Associates
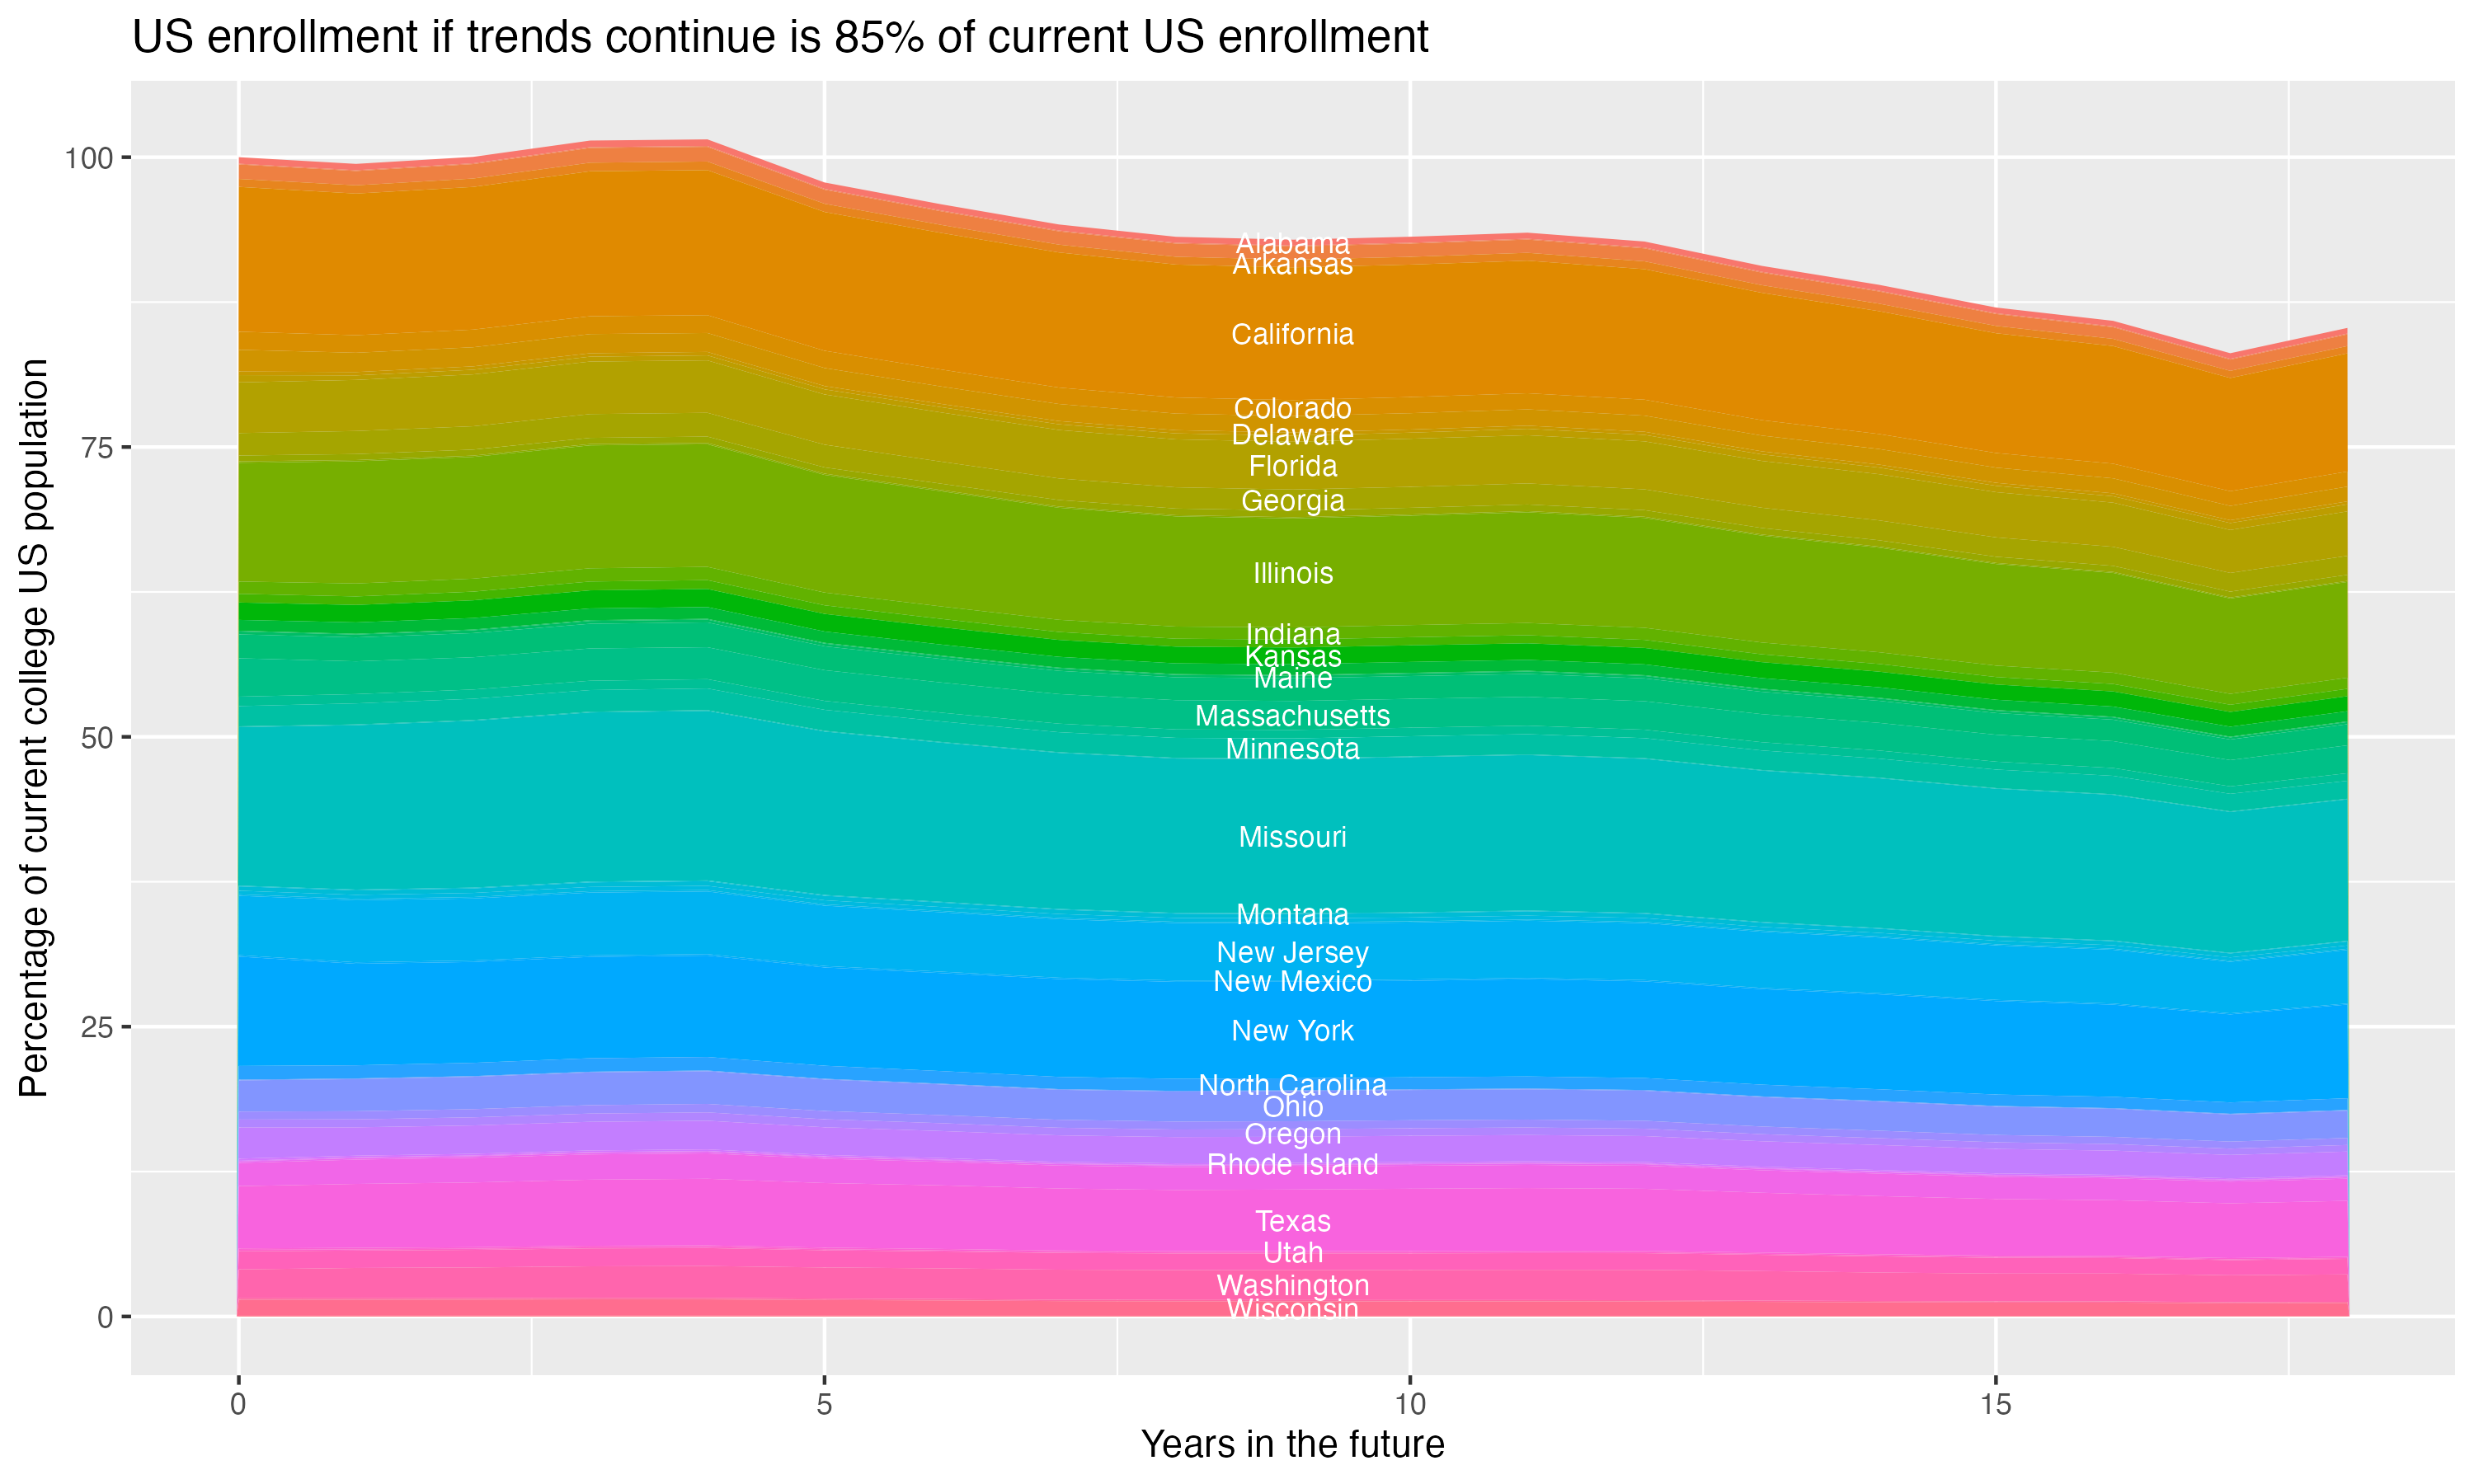
Demographic cliff
There is a concern that giving changing US demographics, the number of students in the age groups who most commonly attend four year colleges will drop off, decreasing overall enrollment. This is often referred to as the “demographic cliff”, and it can be a concern for colleges concerned about the risk of falling enrollment. For this section, the analysis uses US census data on the number of people in each state by age, and the proportion of students that come from each state for this particular college, to crudely model what will happen if everything remains constant except the demographic change in the population of 18 year olds in each year – it does not account for things like the college increasing its admission rate, attracting more students from states without the same demographic changes or from other countries, or changes in the proportion of students who go to college.